The Shortlist Method
How B2B SaaS brands get known before buyers search, get remembered when they do, and turn paid media into pipeline.
Read the foreword and the first five findings now. Unlock the rest to continue reading and download the full PDF.
Why You Don't Have More Qualified Pipeline
Every marketing leader we talk to wants the same thing: more qualified demos and more pipeline. When a paid program isn't producing them, it's almost always for one of four reasons.
The four truths
- Most of your market doesn't know you. About 95% of your buyers won't be shopping this quarter. By the time they are, they'll have a shortlist, and if they've never heard of you, you aren't on it.
- The buyers you do reach don't remember you. Most B2B ads describe features instead of a problem the buyer feels, and they look like every other ad in the category. They get scrolled past, or remembered as someone else's.
- Your program is optimized for leads, not pipeline. Your ad platforms count form fills and find you more of them, including ones sales will never touch. Budget flows to whatever looks cheapest in the dashboard instead of whatever actually turns into opportunities.
- You measure every channel the same way. Search reaches buyers who are already looking, so it should be judged on cost per opportunity. Social mostly reaches buyers who aren't looking yet, so judging it on last-click leads makes it look like waste, and it's usually the first thing cut. When it goes, the buyers your search campaigns depend on start to dry up too.
That's the whole game. Everything in this report helps you get known before buyers start shopping, be remembered when they see you, point your spend at the outcomes your CEO actually measures, and judge each channel by the job it's there to do.
And I mean it when I say most programs miss the first one. In a recent audit, a single branded search campaign was producing 51% of a Series D company's pipeline on 7% of its paid spend. The board saw a paid program that was working. I saw a company living almost entirely off buyers who already knew its name, with very little working on the ones who didn't. That campaign was already near its ceiling. Nothing else in the account was ready to take over.
When it feels like your paid program has hit a wall, you usually haven't saturated the market. You've saturated the small slice of it that already knows you.
The whole program, as one system
A paid program is a system that turns attention into pipeline. Paid social builds familiarity with the 95% who aren't buying yet. Paid search captures the 5% who are. Your CRM tells you whether either one is producing revenue. When one part is missing, the other two look broken.
Most programs we inherit are built for only one part: capture. They buy clicks from people who are already searching, judge everything on cost per lead, and wonder why costs climb every year.
Why you should listen to us
We started Omni Lab in 2021 to run paid media for B2B SaaS companies, and only B2B SaaS companies. Since then we've worked with more than 200 brands, from Series A startups to PE-backed and public companies, and managed seven- and eight-figure ad budgets along the way. Three of the companies we've worked with, Drata, Signifyd, and Upwind, have gone on to become unicorns, and many more have raised their next round.
Those brands are backed by firms like Andreessen Horowitz, Bessemer Venture Partners, Battery Ventures, Coatue, ICONIQ Growth, Bain Capital Ventures, Menlo Ventures, Salesforce Ventures, First Round Capital, and J.P. Morgan Growth Equity Partners.



This report is how we think about the four truths above, and how we run paid search and paid social because of them.
It's written for the people who own the number: VPs of Marketing, CMOs, and Heads of Demand Generation. You won't find bid settings or platform walkthroughs here. Those change every quarter, and your team or agency should own them. For that level of detail on LinkedIn, see our companion guide, The Modern Way B2B SaaS Brands Run LinkedIn Ads. Where we have our own data, we share it. Where we cite outside research, we link to it. Where we tell a story, it happened.
Ten Findings
Most B2B paid programs are built for a linear funnel and judged on last-click leads. The research, and our own data, point to a different design: reach the market before it is buying, capture demand efficiently when it is, and measure both against pipeline.
90% of buyers loop back through at least one buying job, 86% of purchases stall, and the average journey runs about 272 days. A stage-by-stage waterfall reads that as leakage.
Chapter 1The other 95% will buy in months or years, and they can't be pushed in-market by an ad.
Chapter 292% of B2B buyers purchase from the vendor list they started with, and the vendor a buyer prefers before first contact wins about four in five deals.
Chapter 2AI Overviews cut clicks to top-ranking informational content by 58%, and half of B2B software buyers now start research with an AI chatbot more often than with Google. High-intent search is still holding up: across about 40 of our accounts, CTR on commercial-intent terms trended up over the same period. Brand familiarity matters more as a result.
Chapter 3Every dollar should either capture existing demand or build preference for future demand, and each needs its own KPI. Most B2B SaaS companies put over 90% into capture.
Chapter 4In a poll we ran, 54% of B2B SaaS marketing leaders weren't confident their conversion tracking was correct, and more than 80% of the brands we onboard need tracking fixes before launch.
Chapter 5The people who create pipeline are often not the titles being targeted. In one Series B account, not a single C-suite title appeared among opportunity creators.
Chapter 6In one Series B account, spend grew more than 13 times while monthly reach settled near 40% of the audience. The extra budget mostly bought frequency at nearly three times the CPM.
Chapter 8Connecting the CRM to the ad platforms, and judging search on cost per opportunity, helped Thoropass more than double paid SQLs in a single quarter.
Chapters 10 and 11Giving each channel its proper job helped one PE-backed client cut cost per opportunity by 65% in four months, with LinkedIn associated with $3.87M in influenced pipeline. Influence and lift, not stage conversion, are the right measures.
Chapters 12 and 13
How Buyers Actually Buy
- Chapter 01The Funnel Was Never a Line
- Chapter 02The Shortlist Forms Before the Search
- Chapter 03AI Changed Where Buyers Find Answers
The Funnel Was Never a Line
Buyers do not move linearly through your perfectly mapped funnel; preaching to the choir to most marketers. They enter, leave, go quiet for months, and come back through a different door. Most paid programs are still built and reported as if they don't.
A story about how I almost bought something
A few months ago, another vendor mentioned a tool that de-anonymizes website traffic at the account level. Around the same time, I started seeing posts from that company's Director of Demand Gen on LinkedIn. I brought it up with my co-founder, Jason, and we agreed it would be a good fit to integrate into our product.
Then we got busy, and I forgot the company existed.
Months later, someone mentioned them in a community I'm part of. That reminded me, and this time I reached out and booked a meeting. We went all the way to contract before deciding not to buy, so we could stay focused on a few higher priorities.
In their CRM, that's one opportunity, probably sourced to the community or marked as inbound, now closed-lost. It doesn't show the vendor mention, the LinkedIn posts, the months I went dark, or that the deal could come back when our priorities change.
A waterfall report reads that as one lost deal. It assumes the journey runs in a straight line: awareness, interest, MQL, SQL, opportunity, closed-won. The stages are real, but the straight line isn't. I went in and out of awareness more than once, which is very typical if you think about how you evaluate new products.
The funnel is older than most people realize
In 1898, E. St. Elmo Lewis described how a salesperson moves a prospect from attention to action. By the 1920s, the idea had a shape: a funnel, wide at the top and narrow at the bottom.
In 1966, Eugene Schwartz added the piece most B2B programs still ignore. In Breakthrough Advertising, he argued that buyers sit at five levels of awareness, and that your message only works if it meets them where they are.
| Awareness level | What the buyer knows | Are they searching for you? |
|---|---|---|
| Unaware | Doesn't know the problem exists | No |
| Problem aware | Knows the problem, not the solutions | Rarely, and mostly informational |
| Solution aware | Knows solutions exist, not your product | Yes, on category terms |
| Product aware | Knows your product, hasn't decided | Yes, on brand and competitor terms |
| Most aware | Ready to buy, needs the right offer | Yes, on brand terms |
Most of your market sits in the first two rows. They don't know they have the problem, or they don't know a solution exists. Search can't reach them, because they aren't searching yet.
Where the MQL waterfall went wrong
Schwartz was describing where buyers are, not a path they follow. B2B marketing read it as a path anyway.
In 2006, SiriusDecisions introduced the Demand Waterfall. It deserves credit: it gave marketing and sales shared stages and a shared definition of a qualified lead, which beat arguing about lead quality. It also turned the MQL into a trigger. A buyer downloads a guide, crosses a score threshold, and gets pushed to the next stage.
The model assumes buyers move forward one trigger at a time, and that anyone who doesn't is leakage. Most paid programs are still built this way. Campaigns map to stages (TOFU/MOFU/BOFU), success is measured in stage conversion, and a stalled account reads as a failure of whichever campaign touched it last.
The reality most of your content applies to your audience no matter the stage they are in.
The research the Gong Labs put out would be considered TOFU content, but are you telling me that that content should only be seen by people that have never heard of Gong before?
I think not.
What the research says about how buyers move
The data on B2B buying doesn't describe a waterfall. It describes a loop.
| Finding | Source |
|---|---|
| 86% of B2B purchases stall at some point; the average buying group is 13 people | Forrester, State of Business Buying 2024 |
| The average journey runs 272 days from first touch to close, and 81% of it happens before a deal reaches the pipeline | Dreamdata, via CMOtech |
| It takes an average of 54 touchpoints to create an MQL, then 81 more from SQL to closed-won | HockeyStack |
Read those numbers as a measurement problem before a strategy problem. A 272-day journey with dozens of touchpoints and a dozen stakeholders will not fit inside a 30-day attribution window or a stage report built on last touch.
When the report can't see the loop, the team treats the loop as leakage and goes looking for more leads. That is how programs end up spending more to capture the same buyers, while the accounts that went quiet in May get no attention when they come back in October.
Funnel vs. loop
The exception that proves the rule
People can become aware and buy from a single touchpoint. In the data we have reviewed, that is an outlier. It shows up most often in younger SaaS companies with few active channels, lower-priced products, and short sales cycles. If that describes you today, it probably won't describe you after your next funding round.
The funnel isn't wrong. The stages Schwartz described still exist, and every buyer passes through them. What breaks is the assumption that they pass through once, in order, on your timeline.
If your waterfall shows leakage between MQL and SQL, check whether those accounts actually left or just went quiet. The program that is still in front of them when they come back is the one that makes the shortlist. The rest of this report is about building that program.
The Shortlist Forms Before the Search
By the time a buyer types your category into Google, the decision is mostly made.
Only 5% of your market is buying right now
In 2021, Professor John Dawes of the Ehrenberg-Bass Institute published a short paper with LinkedIn's B2B Institute that has since been called the 95:5 rule (it's actually more a heuristic after talking with him personally on our podcast). Only about 5% of B2B buyers are in-market at any given time. The other 95% won't buy for months or even years.
The math is simple. If companies replace a type of software roughly every five years (this can be shorter for some), about 20% of buyers enter the market in a given year, and around 5% in a given quarter. You can't move someone in-market with an ad. They move themselves when a contract ends, a new leader arrives, or a problem gets expensive enough to fix.
LinkedIn's B2B Institute found that 95% of B2B marketers expect significant sales within the first two weeks of a campaign. That expectation only makes sense if you believe ads persuade people to buy on the spot. For 95% of the people who see your ads, they don't.
They create memories that get used later.
The shortlist is set before the evaluation starts
When buyers do enter the market, they don't start from a blank page.
| Finding | Source |
|---|---|
| 86% of B2B buyers have a "Day One" list of vendors before they start shopping, and 92% buy from that list | Google and Bain, B2B Discovery to Devotion study |
| The vendor a buyer prefers before first contact wins about 4 out of 5 deals | 6sense, 2025 Buyer Experience Report |
| Buyers spend 17% of their buying time meeting with suppliers, so with three vendors in play, each gets about 5% | Gartner |
Most of the decision happens in a period your sales team never sees and your attribution model can't credit. Buyers research on their own, talk to peers, and rank vendors in their heads. Then they contact the one they already favor.
When John Dawes, the Ehrenberg-Bass professor behind the 95:5 rule, joined me on The Demand Podcast, I asked him why smaller brands struggle to win deals. His answer was that they rarely lose at the final stage on price or features. They lose before the evaluation starts:

“The reason we're small, the reason we missed out on that sale and that sale and that sale, is because we didn't even get thought of at all.”
The 95/5 split
Why this matters for paid media specifically
Paid search only reaches the bottom three rows of the awareness table in Chapter 1: buyers who already have a list in their head.
That creates a trap. Search looks like the most efficient channel in almost every B2B account, because it shows up at the moment the buyer acts. But search doesn't decide whether your brand is on the list. It harvests the preference that was built somewhere else.
If your brand isn't on the Day One list, a non-brand search campaign is asking a buyer to reconsider a decision they have already mostly made. That's expensive, and it gets more expensive every year as more competitors bid on the same terms.
What we see in accounts
I see this pattern almost every time we audit a new account. A company running 100% demand capture usually has decent efficiency on brand search, mediocre efficiency on non-brand, and rising cost per opportunity overall. Leadership's instinct is to cut whatever looks least efficient, which is usually the top-of-funnel spend that was building the list in the first place.
The question I push leadership teams to ask instead is not "which channel converts best?" It is "which buyers will put us on their list next year, and are we reaching them now?"
It's harder to make the short-list if you spend the majority of your budget on buyers that are already in-market and have likely created their own short-list. You have to be on it before the buyer starts one. That means a meaningful share of your paid budget has to work on the 95% who aren't buying yet, and you need a way to judge that spend that doesn't depend on last-click conversions. Chapters 4 and 13 cover both.
And by the way, this isn't just a paid media activity, of course. This is across all sorts of distribution channels, such as SEO, AEO, events, you name it.
AI Changed Where Buyers Find Answers
AI hasn't changed why B2B buyers buy. It has changed where they go to learn, and that's eating into two of the most common line items in a B2B paid program: informational search and gated content.
Fewer people click, even when they search
Ahrefs' first study, published in April 2025, looked at 300,000 keywords and found that an AI Overview in Google's results correlated with a 34.5% lower click-through rate for the top-ranking page. It also found that 99.2% of keywords that trigger AI Overviews are informational.
In its December 2025 update, the gap had grown. Using the same method, Ahrefs found AI Overviews now reduce the click-through rate for position-one content by 58%. Clicks on informational keywords without an AI Overview also fell, which tells you the shift is broader than one search feature.
Position-one click-through rate, December 2023 vs. December 2025
When someone asks Google "what is revenue attribution" or "how to reduce SOC 2 audit time," the answer increasingly appears on the results page. The buyer learns something. Your website, and your ad, often never gets the visit.
High-intent search is holding up
We don't bid on informational keywords, so our own data tells the other half of the story. Across roughly 40 Omni Lab accounts, Google Ads click-through rate on the brand and commercial-intent terms we buy trended up from about 4% to about 5.5% between January 2025 and October 2026.
AI is absorbing the "help me understand" searches. The "help me buy" searches still lead to a click, because someone ready to evaluate a vendor wants to see the vendor. The accounts in our data changed over the period, so treat this as a direction, not a precise measure. But the direction is clear: high-intent search is still worth paying for.
Interestingly, an analysis of our own data from sources that we could infer came from ChatGPT or an LLM often shows that they are in research mode and a lot colder when they come inbound to talk to us about running their paid media program.
This, of course, makes some sense because LLMs are often a starting point for people now to do research.
Google Ads CTR across roughly 40 Omni Lab accounts, January 2025 to October 2026
Many buyers skip the search engine entirely
Search is only part of the shift. In G2's March 2026 survey of 1,076 B2B software buyers, 51% said they now start research with an AI chatbot more often than with Google, up from 29% in G2's 2025 report. AI chatbots were the top source influencing which vendors made the shortlist, and 69% of buyers said they chose a different vendor than planned because of a chatbot's recommendation.
6sense found the same direction in its 2025 Buyer Experience Report: the large majority of buyers now use large language models somewhere in the buying process. Yet buyers still averaged about 16 interactions with the winning vendor. AI compresses research. It doesn't replace trust.
The same thing is happening to your content library. A buyer who wants to understand a topic can now get a clear, free summary in seconds. Fewer of them will hand over an email address for a 30-page ebook that says what an LLM can say in a paragraph.
We hope this doesn't fall into that category; we certainly put a lot of work into this. ;)
What AI is eroding in a typical program
| Program element | What's changing | What to do about it |
|---|---|---|
| Informational and top-of-funnel search | Fewer clicks, lower intent, rising cost per opportunity | Shift budget to commercial-intent, brand, and competitor terms (Chapter 10) |
| Gated content as a lead source | Buyers can get the answer elsewhere, so form fills fall and lead quality drops | Publish what AI can't produce: your own data, a clear point of view, stories with names and numbers (like this) |
| Generic thought leadership | Easy to produce, so there is far more of it, and it all sounds alike | Put people with actual opinions in front of your ICP (Chapter 9) |
| Brand familiarity | Matters more, because a familiar brand is more likely to be named and trusted | Reach the 95% consistently, not only when they search (Chapters 7 and 8) |
The standard we now hold content to
We use a simple test before promoting anything in paid media: could someone get this answer from an AI tool in 30 seconds? If yes, we don't put paid budget behind it.
That rules out a surprising amount of standard B2B content: definitional guides, generic checklists, and "ultimate guides" to a category. What survives is content only your company can make: your own customer data, benchmarks from your product, a strong opinion from someone who has done the job, or a story with real numbers in it.
Brand matters more, not less
It's tempting to read all of this as a search problem. It's really a brand problem.
When a buyer asks an AI tool for the best tools in your category, the answer reflects which brands are mentioned, reviewed, and discussed across the web.
When the buyer reads that answer, the brands they already recognize get more trust. In both cases, being known beforehand does the work. That's exactly what Chapter 2 described: the shortlist is formed before the search, and AI has made that even more true.
Paid media can't buy a place in an AI answer. Ads are starting to appear inside AI tools (e.g. ChatGPT Ads), and we are testing them, but it is early. What paid media can do today is build the familiarity that makes your brand recognizable when it shows up in an answer, and make sure you are present when a buyer moves from asking questions to evaluating vendors.
AI also changes how paid programs are run. We use our own platform, Omni OS, to handle the work that used to slow programs down: spotting performance problems, pacing budgets, and answering questions about results. We cover that in Chapter 14.
The short version: if your strategy is to buy more informational clicks and gate more ebooks, AI will help you do that faster. It won't make it work.
Audit your program for spend that depends on buyers clicking to learn. Informational keywords and gated content are the two places AI is most likely costing you money without telling you. Move that budget toward reaching your ICP where they spend time, with content they can't get anywhere else, and toward capturing buyers once they are actually evaluating.
The Operating Model
- Chapter 04Two Objectives, Not Channels
- Chapter 05Diagnosis Before Spend
Two Objectives, Not Channels
Every dollar in a paid program should serve one of two objectives: capturing demand that already exists, or building preference with buyers who will be in market later. Most budget fights in B2B marketing happen because a team is arguing about channels when it should be arguing about objectives.
Channel-first vs. objective-first
Channel-first thinking says: "Our job is to optimize LinkedIn. Let's test new audiences, improve the ad copy, and increase reach." Success is measured by LinkedIn's attributed performance.
Objective-first thinking says: "Our job is to build preference with the 95% of the market that isn't buying yet, so that when they enter the market, they know us, trust us, and consider us. LinkedIn is one tool for that."
The difference sounds academic until budget gets tight. A channel-first team cuts whatever has the worst last-click numbers. An objective-first team asks what each dollar is supposed to do, and whether it is doing it.
Again that's not to say you don't test new audiences, understand what pain points resonate more than others, it just means that you zoom out and go back to first principals on what the program is trying to accomplish.
The two objectives
| Demand capture | Brand development | |
|---|---|---|
| Definition | Maximize attributable conversions while minimizing attributable cost | Build recognition, trust, and preference with buyers not yet in market |
| Who it reaches | The ~5% actively evaluating | The ~95% who will buy later |
| Typical tactics | High-intent search, retargeting, direct offers | Thought leadership, educational content, product marketing to cold audiences |
| Primary KPI | Cost per qualified opportunity trending down | Accounts exposed progressing faster through the sales funnel |
| Supporting signals | Impression share, CTR, cost per SQL | Reach of 30 to 40% of the ICP at 3 to 5x frequency, engagement, pipeline influence |
| Time to show results | Weeks/Months | Months/Quarters |
These are not competing philosophies. Demand capture on its own leads to rising acquisition costs and diminishing returns, because you are competing for the same small group of buyers as every other vendor.
Brand development on its own doesn't produce measurable pipeline in the time most companies can wait. Together they feed each other: brand development makes the buyers you later capture cheaper to convert.
What the research says about the balance
In 2019, Les Binet and Peter Field analyzed the IPA effectiveness database for LinkedIn's B2B Institute. They found that B2B businesses grow best when roughly 46% of budget goes to brand building and 54% to activation.
They also found that brand campaigns build memories that make future activation more effective, and that brand activity works best with wide targeting while activation works best with specific targeting.
The authors themselves called the B2B findings tentative, since the sample was smaller and skewed toward larger budgets. We treat the 46/54 split as a direction, not a rule. Very few B2B SaaS companies we meet are anywhere close to it. Most are at 90% or more on activation.
How the balance shifts by stage and budget
The right mix depends on where the company is. These are the starting points we use.
| Situation | Where we usually start | Where we aim in 12 months |
|---|---|---|
| Seed or Series A, monthly paid budget under about $50K, needs to prove ROI quickly | Mostly demand capture, with a small brand layer on LinkedIn | About 80/20 capture to brand |
| Series B or C, budget scaling, inbound demand flattening | Capture plus a dedicated brand layer from day one | About 60/40 |
| Series C+ or PE-backed, $100K+ a month, category is crowded | Balanced from day one | Closer to 50/50 |
Two signals usually tell us brand development is underfunded. Branded search volume is flat or falling while non-brand costs rise. And sales reports that prospects "have never heard of us" in first calls.
When someone wants to cut brand
The most common request I hear under budget pressure is to pause brand spend and go all-in on demand capture. I've had that conversation more times than I can count, and my answer follows the same pattern every time.
In the short term, cutting brand often looks fine. Capture campaigns keep converting the buyers who were already warmed up. Cost per lead may even improve for a quarter. Over the next two to three quarters, the pool of buyers who recognize you starts to shrink, branded search softens, and non-brand campaigns have to do more of the work at a higher price.
So I lay out three things: what going all-in on capture will do this quarter, what it is likely to cost over the next year, and what we would recommend instead. Sometimes cutting brand is the right call, such as when the company needs cash efficiency above everything else. It should be a deliberate trade-off, not a reaction to a last-click report.
Before your next budget review, label every line in your paid plan as either demand capture or brand development, and give each a KPI that fits its job. If you are judging brand campaigns on cost per lead, you are measuring them against a job they were never meant to do.
Diagnosis Before Spend
The most expensive mistake in paid media is not a bad ad or a wrong bid. It is spending a quarter optimizing toward a goal nobody agreed on. A week of alignment up front saves a month of executing in the wrong direction.
The four variables we diagnose first
The operating model is the same for every client. What changes is how we apply it, and that depends on four variables.
| Variable | The question | Why it changes the plan |
|---|---|---|
| Attribution model | How does the company credit marketing: first touch, last touch, multi-touch, or self-reported? | Determines what we optimize toward and how results will be judged |
| Target KPI | What is marketing measured on: MQLs, SQLs, pipeline, revenue, deal velocity? | Determines what campaigns are built to produce and what gets reported |
| Budget size | How much, how flexible, and who can move it? | Smaller budgets usually start with demand capture; larger budgets can run both objectives from day one |
| Company stage | Seed through Series A, Series B and C, or later? | Earlier companies need short-term proof; later companies have room for longer-term brand investment |
The problem is that even if we know what a company should do, we often need to first align with the way that they are measured and the accepted attribution model of the company (as this is how they are currently incentivized and compensated).
Then it's about building on additional data points to that narrative to evolve the KPIs that we measure and the attribution models that we use. (easier said than done)
Define the End State
Once the variables are clear, we work with the client to define the End State: what success looks like 12 months from now. A few real examples of how teams have framed it:
- "We need more leads and have to prove we can scale demand capture."
- "We have strong demand capture, but we're under-invested in brand. We need to build preference with our ICP before they're in market."
- "We need to prove the link between our brand campaigns and downstream pipeline."
The End State becomes the reference point for every trade-off. When a new channel, a new test, or a budget cut comes up, the question is whether it moves us toward the End State.
The alignment questions to settle before launch
These are the questions we try resolve before any campaign goes live. If you can't answer one of them today, that is the first thing to fix.
- Success KPIs. What is marketing measured on, primary and secondary? Who owns reporting on it?
- Attribution. Which model does the company accept, and which CRM field is the source of truth?
- ICP. Job titles, company size, industries, use case, geography, and size of the buying committee.
- Lead quality. Which CRM stage means "a good lead": MQL, SQL, or opportunity?
- Data quality. Are there duplicates, unattributed records, or orphaned leads? What is the last three to six months of MQL and SQL history? How long does it take a form fill to become an MQL?
- Budget. Total monthly amount, flexibility to move it mid-month, seasonality, and who can approve changes.
- Tech stack. Which CRM, which ad platforms, and how they connect today.
- Decision rights. Who approves budget changes, who owns results, and whether those people agree on the strategy.
- Objective balance. Start with capture and layer in brand, or run both from day one? What is the target balance in 12 months?
Question 5 is where I see the most programs break. In a poll we ran, 54% of B2B SaaS marketing leaders said they were not confident their conversion tracking was set up correctly.
In our own onboarding work, more than 80% of the brands we take on have some tracking issue we need to fix before launching campaigns. If the data feeding the ad platforms is wrong, the algorithms optimize toward the wrong outcome, and every report built on top of it is wrong too.
ShareGate: fundamentals before anything new
During a routine review at ShareGate, we spotted a sharp drop in reported sign-up conversions. A backend code change on their side had broken the conversion trigger, and nothing in the ad platforms flagged it. Left alone, the account would have kept optimizing against bad data indefinitely.
We fixed it with their team, then kept working down the list of fundamentals: separating high-intent search terms that were being crowded out by broader traffic, matching bidding to the account's real maturity, and focusing LinkedIn on the IT decision-makers who became SQLs. Within 90 days, ShareGate hit consecutive all-time highs in top-of-funnel demand, and SQLs grew 44% year over year.

“This wasn't done by implementing some brand-new flashy marketing playbook, but by focusing on marketing fundamentals.”
Benchmarks come from your data, not industry averages
We don't set targets from industry benchmarks. A "good" cost per opportunity for a $15K ACV product is a bad one for a $150K ACV product. We set initial targets from the client's own history across every channel, then refine them over the first 60 to 90 days as we learn the account.
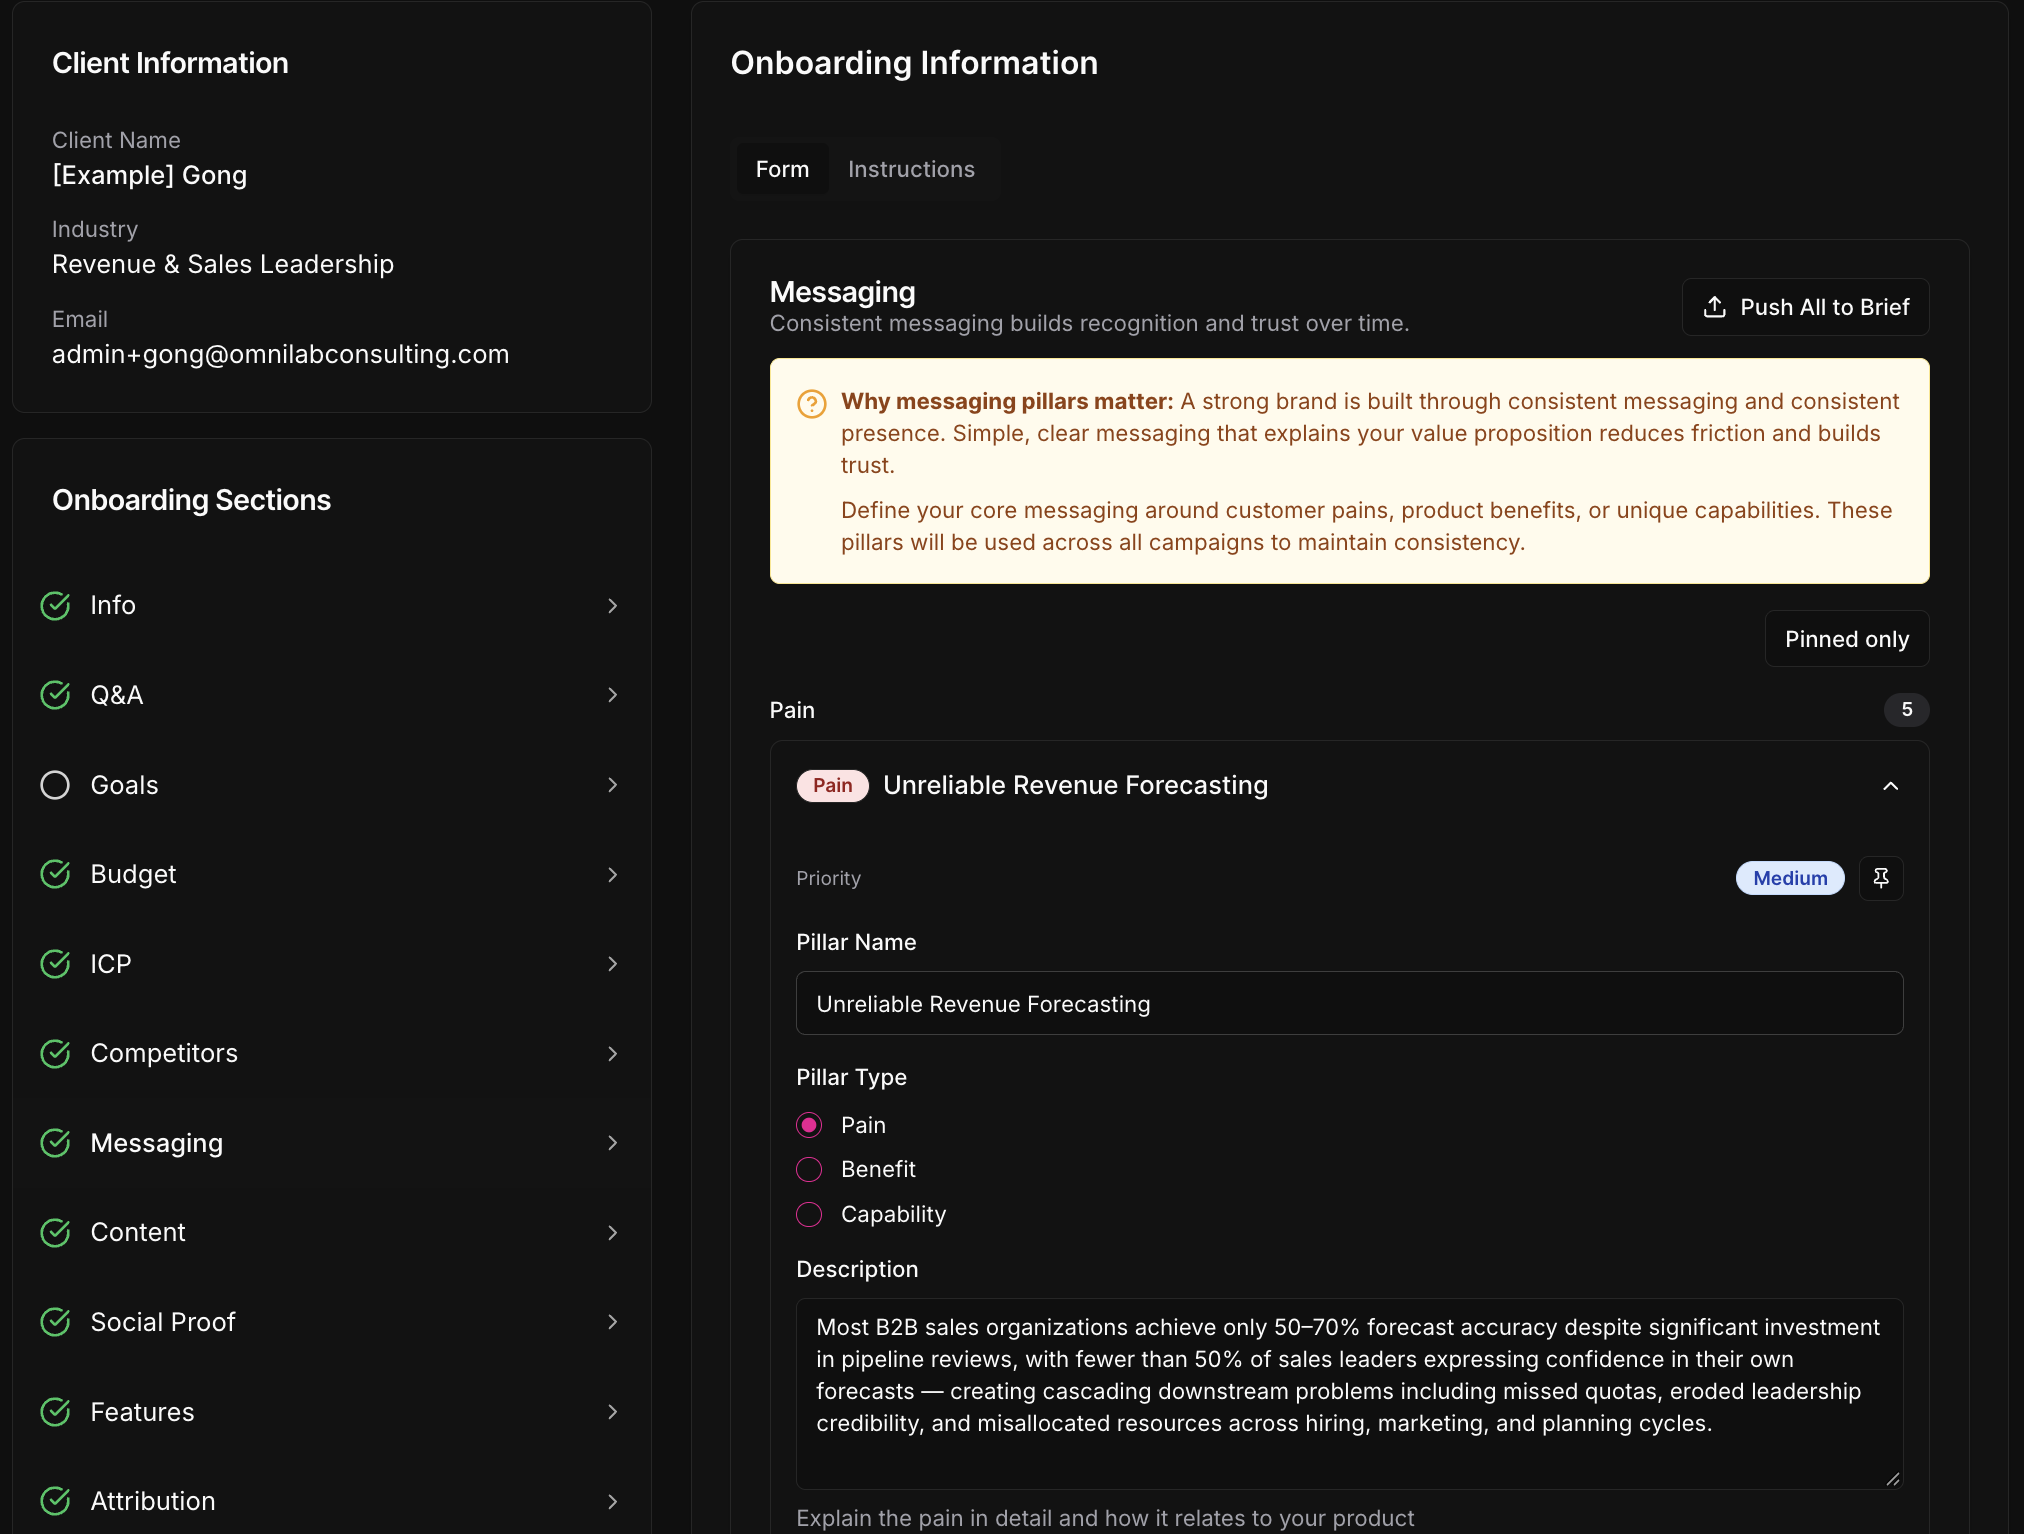
This part of the work used to mean weeks of documents going back and forth. Internally, we use Omni OS to shorten it to days. It reviews the client's website and any materials they share, and pre-fills a client brief with the company description, ICP, messaging, competitors, and goals. The client's team spends its time correcting and adding to that brief rather than writing it from scratch.
Omni OS · Client Brief
The diagnosis and End State live in the same place. When a test is proposed six months in, or a new team member joins the account, the reasons behind the plan are written down next to the plan.
Ask your team or agency to write down the four variables, the End State, and the answers to the nine questions above in one place. If they can't, or if two of your executives would answer differently, settle that before you approve the next quarter's budget.
Paid Social Builds Preference With the 95%
- Chapter 06Know Who Converts and What They Feel
- Chapter 07Two Layers, Always On
- Chapter 08Reach Has a Ceiling
- Chapter 09Creative That Earns Attention
Know Who Converts and What They Feel
The cheapest way to improve a paid social program is to aim it at the segments that already turn into pipeline, with messages built around problems those buyers already recognize. Both answers are usually sitting in your CRM and your sales call recordings.
Most teams never pull them out before launching.
Step 1: Find the segments that actually convert
We start every paid social engagement the same way, we ask or export opportunity data from the CRM and look at what segments generate net new pipeline.
Not who you think your buyer is. Not who sales wishes it were selling to. Who shows up in opportunities, and who closes.
A Series C SaaS company had been targeting a set of senior titles on LinkedIn for months. When we compared the titles attached to opportunities in their CRM with the titles they were paying to reach, there was very little overlap. The people creating pipeline were a long list of program directors and coordinators that no one had thought to target.
At a Series B company selling into mid-market and enterprise, we pulled every contact associated with opportunity creation in HubSpot. The list was full of EHS managers, safety analysts, and sustainability directors at large manufacturers. There was not a single C-suite title on it.
CRM · Titles associated with opportunity creation, Series B
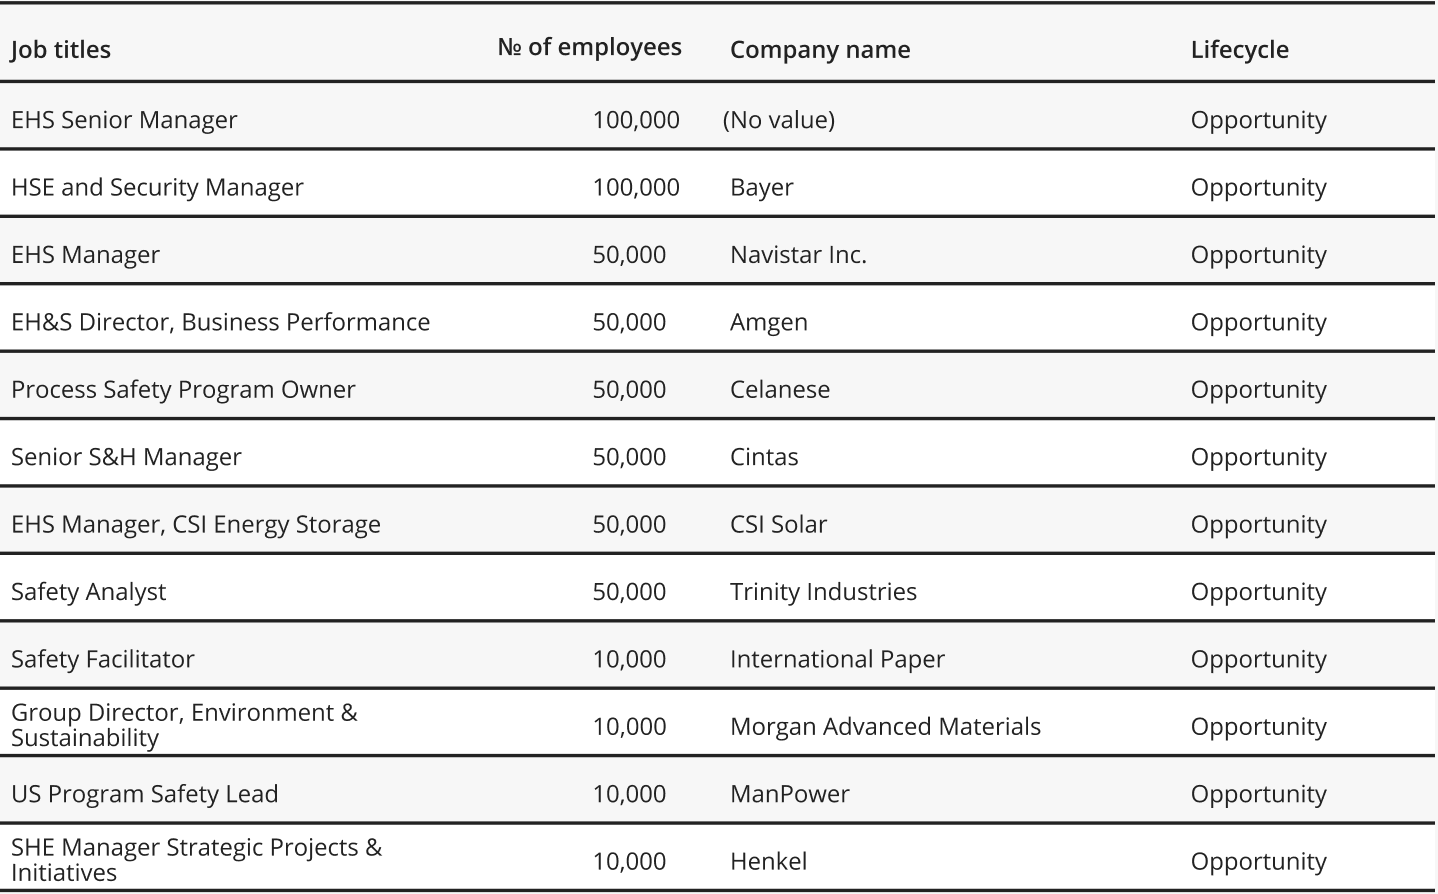
That second pattern is one we see across most of the 200+ B2B SaaS brands we have worked with. In mid-market and enterprise companies, executives benefit from the outcome your product delivers, but they rarely feel the problem day to day.
The people who feel the pain are managers, practitioners, and end users. They are the ones who start buying cycles and come in through inbound. Executives matter for the signature, and they belong in your audience, but they shouldn't be the whole audience.
The exception is SMB, where founders and executives are still close to daily operations and often feel the pain directly.
What to pull, and who to ask
| Source | What it tells you |
|---|---|
| CRM opportunity data | Titles, industries, company sizes, and regions most associated with opportunity creation and closed-won revenue |
| Ad platform data (LinkedIn especially) | Which segments engage and convert in-platform, to compare against CRM truth |
| Finance | Which segments churn least and pay most |
| Product and customer success | Which segments expand usage and report the most success |
| Market data | Which segments are growing fastest, even if your history there is thin |
Andrei Zinkevich of Fullfunnel tells the story of a corporate learning platform that spent a year targeting HR and L&D teams across enterprise companies, before discovering it had been speaking generically to segments with very different needs. Conversion rates were low, cost per lead was high, and revenue was missed. As he puts it, building a broad ICP and targeting a sales wishlist is like playing the lottery.
The goal here is not to shrink the audience to the smallest possible list. It's to make sure the first dollars you spend go to the segments with the highest chance of producing pipeline. That's how you take risk out of the program.
Audience size matters less than ICP fit (don't listen to ad channel reps).
Step 2: Rank the pain points, segment by segment
A CFO and a demand gen manager at the same account care about different problems. So do an IT director and a security engineer. Before writing a single ad, we organize pain points by segment and rank them.
We work with each brand to pull the top pain points from five places.
- Sales calls. Recurring objections and the exact words prospects use to describe their problem, pulled straight from call recordings.
- Customer interviews. We ask recent buyers what triggered the search and what almost stopped them from buying.
- Surveys. Short surveys of customers and prospects let you rank problems across a larger sample than interviews can cover.
- Customer success and customer data. The team closest to renewals and churn knows which problems the product solves well, and usage data shows which features customers depend on.
- Ad and content performance. What already resonates in-platform and in organic content is evidence too.
Then the client's team ranks the pain points for each segment. We build creative around the top two or three, and mix and match angles across them.
The point of ranking is focus. Most B2B companies can list fifteen problems their product solves. Buyers will remember one or two, if they remember anything.
Then let the ads tell you what resonates
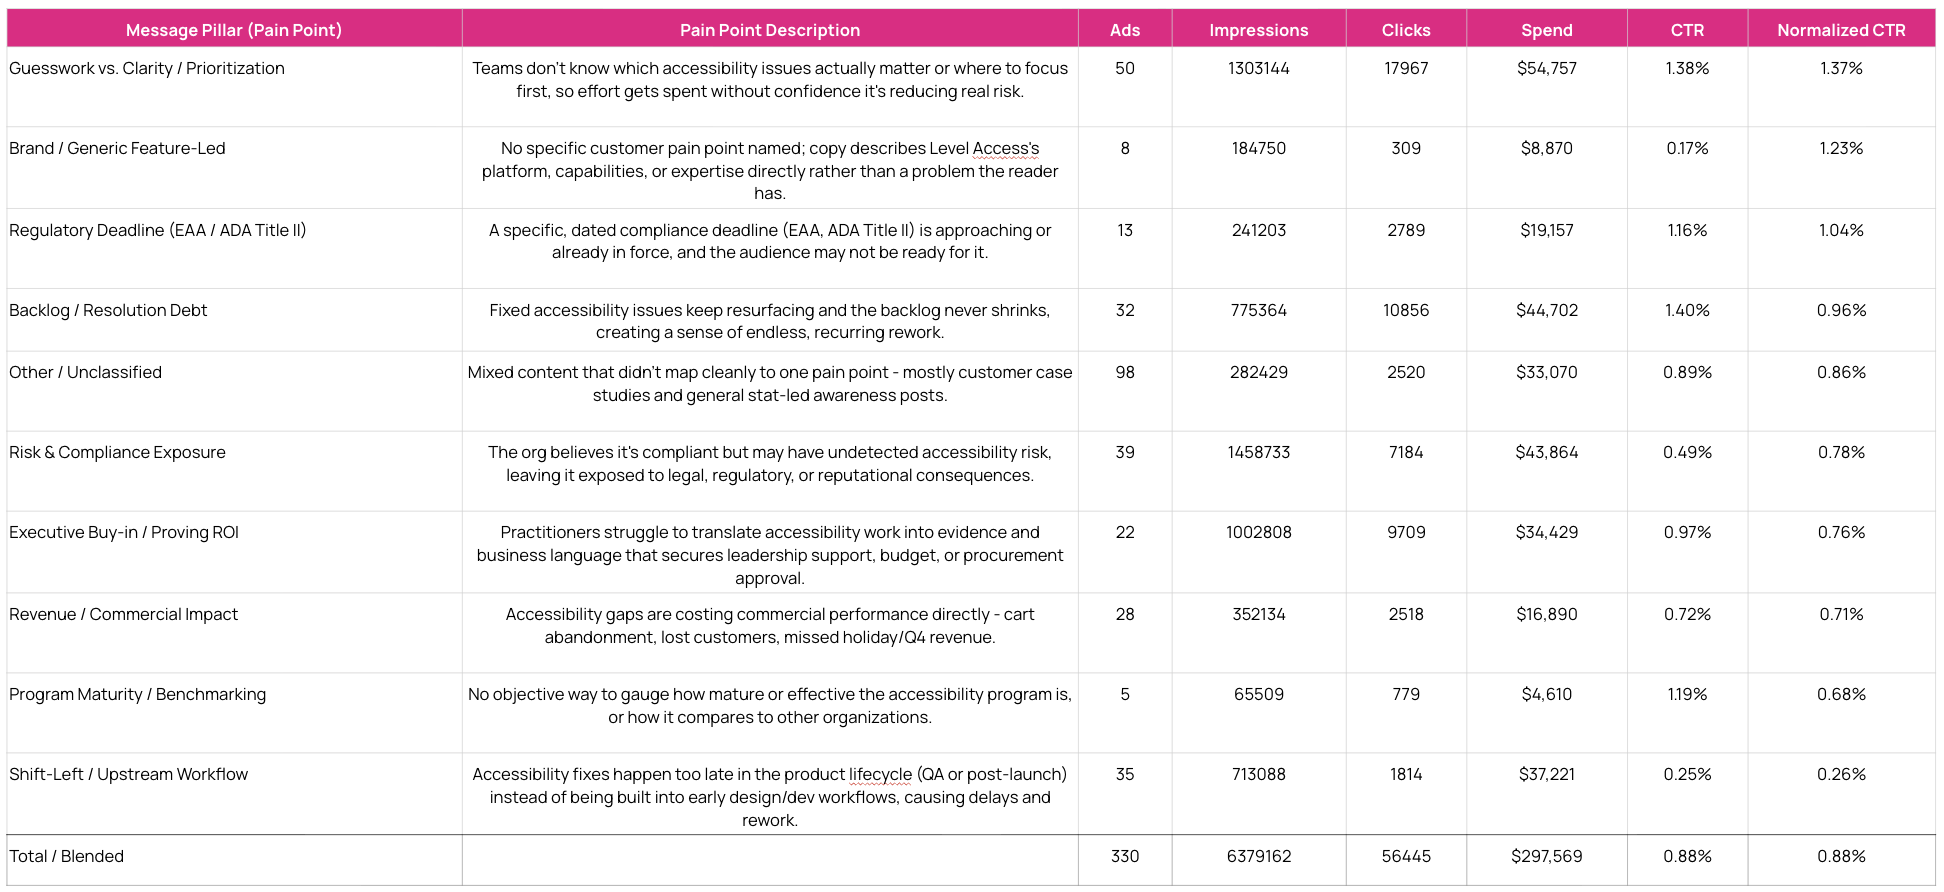
Interviews, surveys, and call recordings give you a strong starting ranking before a dollar is spent. Once ads are running, you get a second opinion from the market. We tag every ad by the pain point it leads with, then compare performance across pain points rather than ad by ad.
For one accessibility software client, we tagged 330 LinkedIn ads across ten pain points. The spread was wide. Ads about not knowing which issues to fix first earned about five times the normalized click-through rate of ads about moving accessibility earlier in the development process. And the risk and compliance message, which got more impressions than any other, performed below the account average.
That last finding is the useful one. The message a company leads with isn't always the one buyers respond to. But this view gives a clear signal on where to put the next round of creative, and which messages to retire.
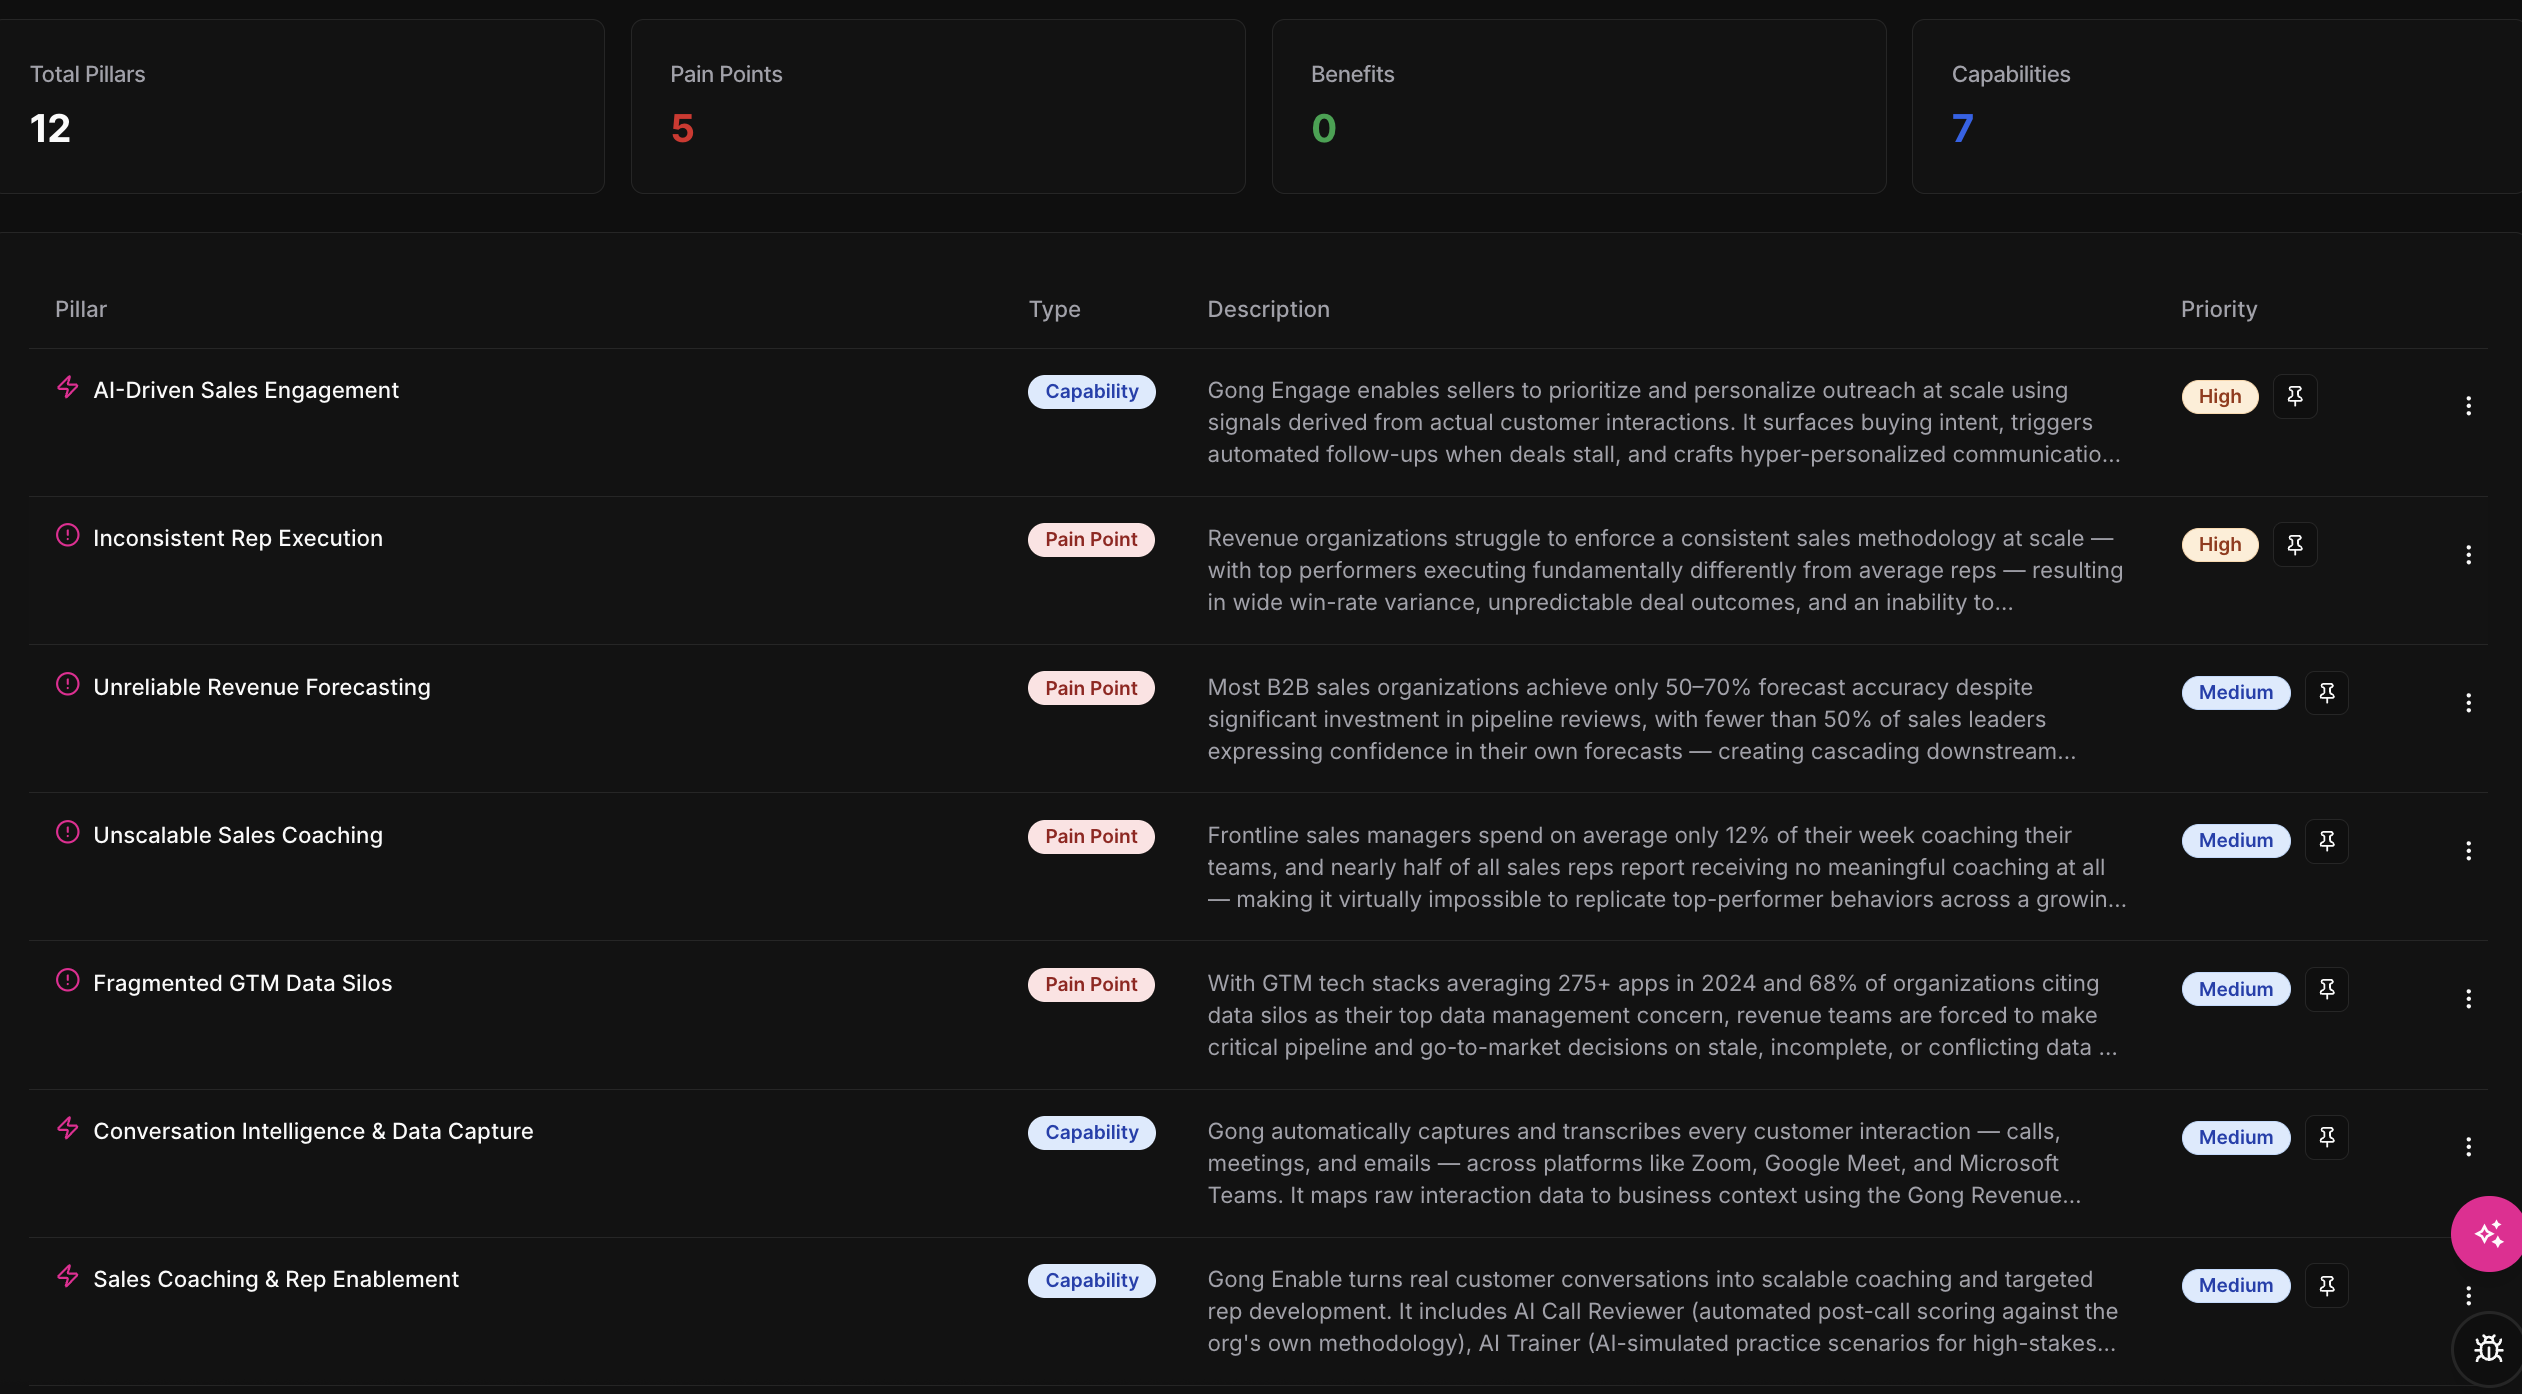
ICP definitions live in the client brief, where teams can compare profiles side by side and launch an audience directly from one. Pain points are captured in the same brief, tagged with where they came from, and ranked by the client's team. When we build creative, it starts from that ranked list.
Pain point performance by message pillar
Omni OS · Client Brief, Messaging
Before approving a paid social plan, ask two questions. Which three segments created the most pipeline last year, according to the CRM? And what are the top three pain points for each, according to your customers rather than your positioning deck? If either answer is a guess, the program is starting with more risk than it needs to.
Two Layers, Always On
If buyers can be at any stage at any time, your program has to be present at every stage at once. On paid social, that means two layers running side by side: one builds preference with the 95% who aren't buying, and one converts the accounts that show intent. Neither is a step in a sequence. Both run all the time.
Layer 1: The out-of-market layer
This layer reaches your full ICP, most of whom are not evaluating anything. Its job is to make your brand familiar and associated with the problem you solve, so you are on the list when they do start looking.
- Channels: LinkedIn first for most B2B SaaS companies, with YouTube, Meta, Reddit, and display added based on where your ICP spends time.
- Content: thought leadership, top-of-funnel education, and product marketing.
- Goal: build preference and fill the retargeting pools.
- How it's judged: reach, frequency, engagement, CTR, ICP traffic to the website, and, on LinkedIn, pipeline influence.
The out-of-market layer answers the questions buyers aren't asking out loud yet.
| Content lane | The buyer's unspoken question |
|---|---|
| Problem recognition (top of funnel) | Does this problem actually affect me? Is how I handle this today quietly broken? Is this a bigger deal than I've been treating it as? |
| Product tied to the job (product marketing) | Where does this product fit into my work? Who already does this job, and could they do it for me? |
| Narrative presence (thought leadership) | Is this a voice I should listen to? Is this a name I recognize? |
Layer 2: The in-market layer
This layer reaches accounts that have shown interest: they engaged with an ad, visited the website, or are surging on intent data. Its job is to give proof to buyers who are already interested.
- Channels: retargeting on LinkedIn, Meta, YouTube, Reddit, and display, plus intent channels like Google Ads and Bing Ads.
- Content: product marketing, social proof, and direct offers.
- Goal: capture demand from warm accounts.
- How it's judged: MQLs, SQLs, pipeline, and cost per opportunity.
The in-market layer answers what the 5% are actively asking: How does it work? What does it integrate with? Who else uses it? What's the ROI? Why move now instead of later?
Two layers, one brand
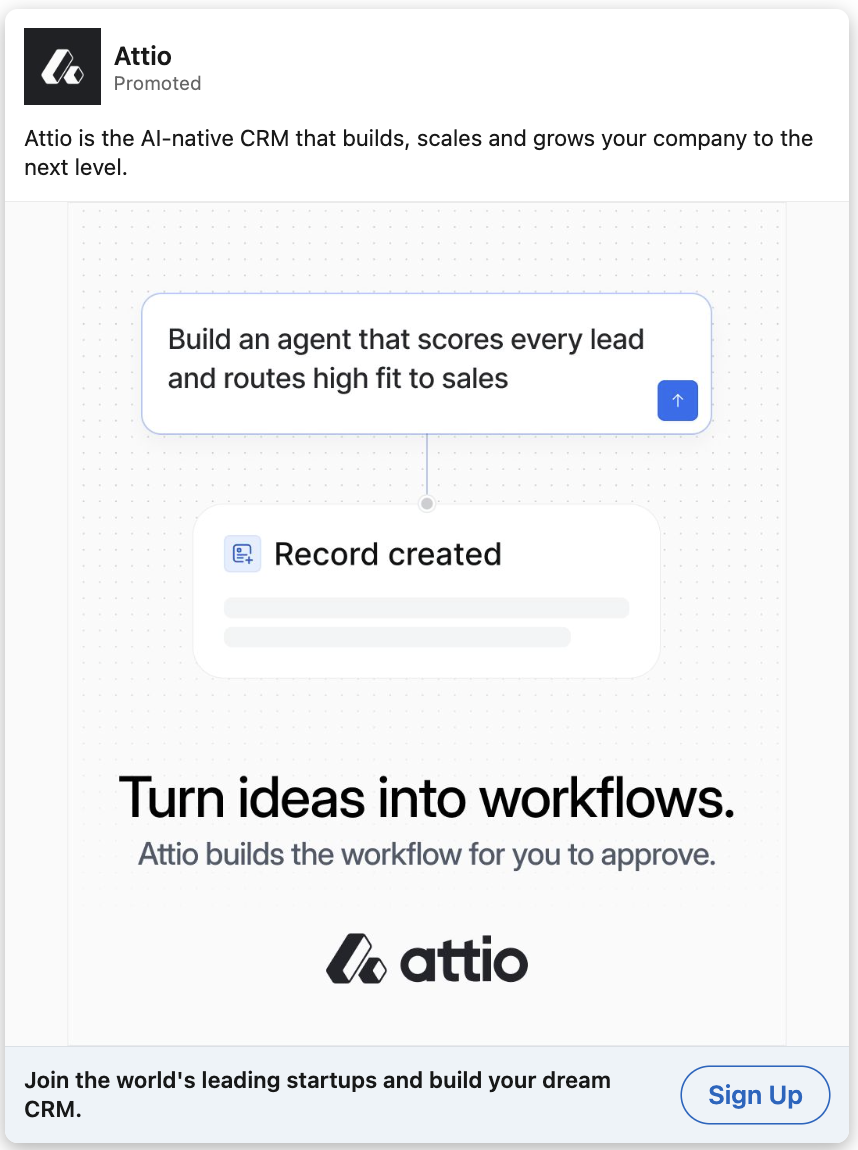
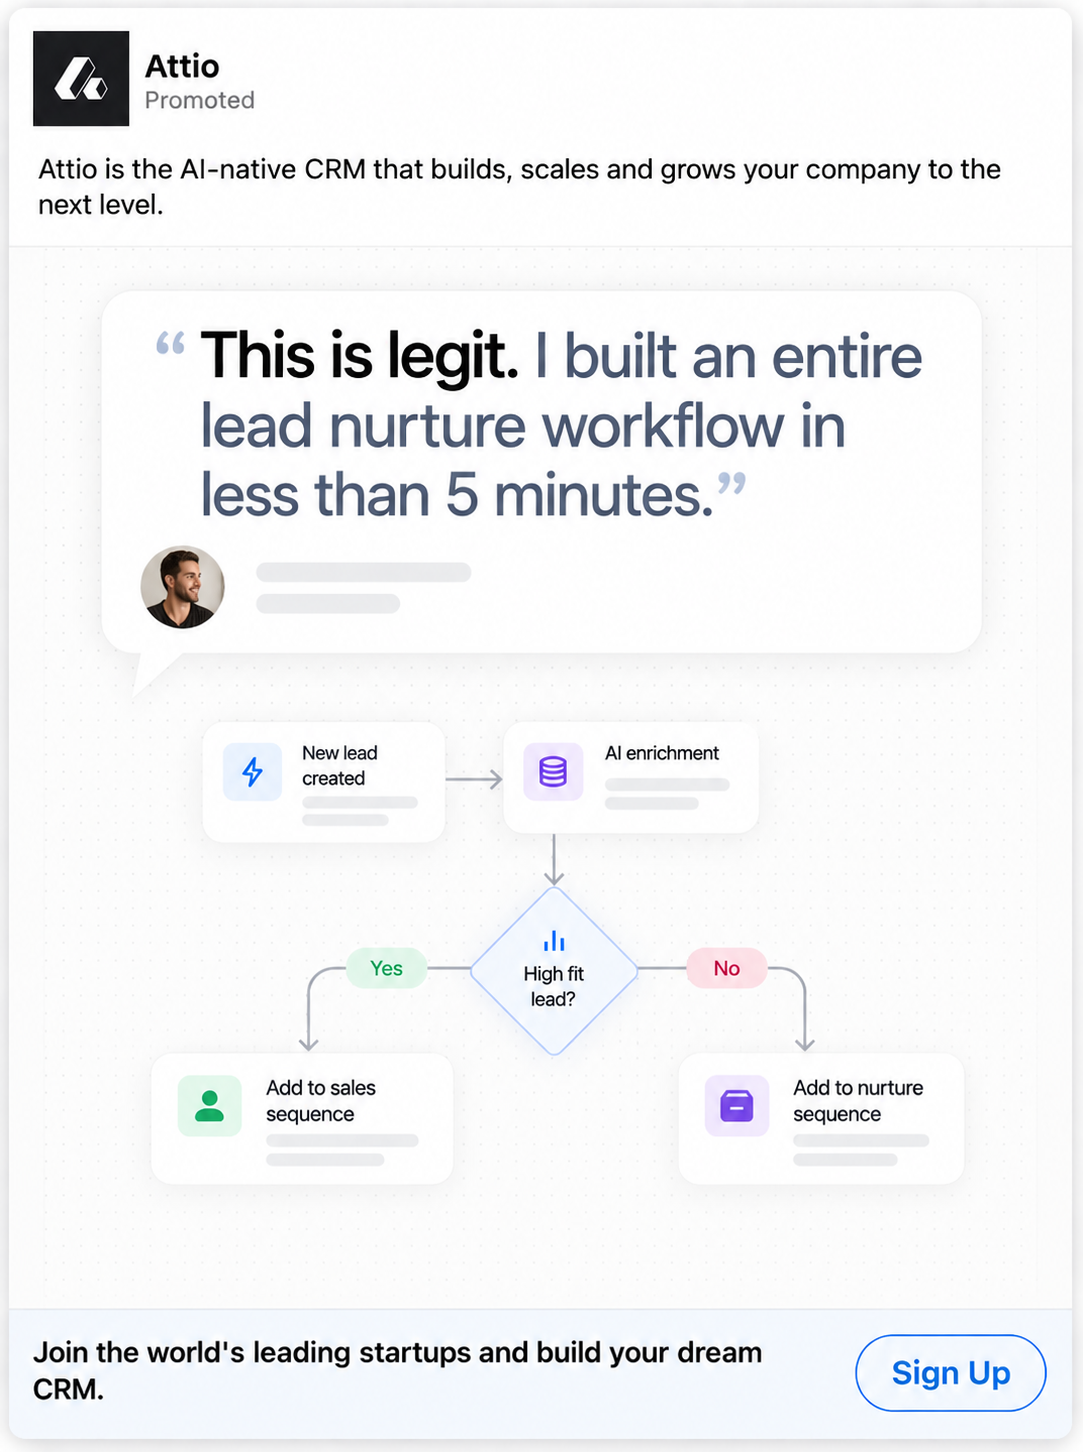
Let engagement decide where an account goes next
We don't try to push an account from one stage to the next. We let the account's own behavior decide which layer it sees.
Engagement decides what an account sees next.
When someone engages with an ad or visits the site, they move into retargeting. Those audiences are built on 30, 90, and 180-day windows, and the creative shifts toward product marketing, social proof, and direct offers.
If the account converts, we can add it to a deal acceleration campaign (if part of the strategy). That campaign targets open opportunities synced from the CRM and keeps the whole buying committee seeing proof while sales works the deal.
If the account doesn't convert within 30 days, it goes back to the out-of-market layer. It keeps seeing thought leadership until it shows intent again. That's how a vendor stays in front of someone like me during the months I went dark in Chapter 1.
Why deal acceleration earns its budget
The buying committee is large, and most of its members never visit your website. Deal acceleration puts proof in front of the people sales hasn't met yet.
The team at UserGems shared results from running one-to-one ads to every open opportunity: compared with opportunities that didn't receive them, they saw 31% higher win rates, 25% larger deal sizes, 67% more prospects engaged in each deal, and 17% shorter sales cycles.
Your results will vary, but it's one of the easiest places to draw a direct line from paid social to revenue.
Keep the structure simple
The two-layer model can be over-built quickly. We see accounts with 100 or more campaigns, each with a thin budget that never gets enough delivery to learn anything.
Our basic rule for campaign segmentation: when you have messaging or content that is specific to an industry, persona, or company size then these are great reasons to segment.
These are the variables that usually justify a new segment:
| Variable | Worth its own campaign when... |
|---|---|
| Ad format | The format changes the job, like a video built for reach vs. a document ad built for engagement |
| Objective | The campaign is optimizing for something different: reach, engagement, or conversions |
| Geo | Markets differ in language, budget, cost, or messaging |
| Product | Each product has its own buyer or its own story |
| Persona | You have pain points and messaging written for that role |
| Industry | You have messaging or proof specific to that industry |
| Company size | The problem looks different at SMB, mid-market, and enterprise, and your messaging reflects it |
If you don't yet have specific pain points, messaging, or content for an industry, persona, or company size, it's probably not worth segmenting by it. Splitting a campaign without changing the message just spreads the same ad across thinner budgets.
One more structural choice matters to leadership: where a demo request lands. For gated content, LinkedIn's native lead forms work well because they reduce friction.
For demo and first-meeting campaigns, we send buyers to a landing page. Someone who clicks through, explores the site, and books a meeting is showing much stronger intent than someone who submits a pre-filled form without leaving their feed, and we see that difference in show rates.
Ask to see your paid social program as two layers with separate goals and separate KPIs. If every campaign is judged on cost per lead, the out-of-market layer will always look like waste and will be the first thing cut.
If there is no out-of-market layer at all, your retargeting pools will slowly dry up, and so will the warm demand your search campaigns depend on.
Reach Has a Ceiling
On paid social, you can only reach so much of your audience in a given month, no matter how much you spend. Past that point, more budget buys frequency and higher costs, not more people. Knowing where that ceiling sits is the difference between scaling a program and overpaying for it.
The targets we use
For the out-of-market layer, we aim to reach 30 to 40% of the ICP at a frequency of 3 to 5 times per month at the campaign level (again more directional vs. a black-and-white rule). For retargeting, where audiences are smaller and warmer, we aim for 7 to 9 times.
Why not 100%? Because not every member of your audience is active on the platform in a given month. Some log in daily. Some log in once a quarter. In our experience, 30 to 40% is close to the share of a B2B audience you can reach in a typical month. Treat the range as a direction, not a pass-or-fail test.
What happened when one account kept spending
We pulled six months of data from a Series B B2B SaaS company that scaled a single LinkedIn campaign from about $1,000 to about $14,500 per month, against the same audience of 32,000 people.
Spend rose more than 13x while monthly reach stayed near 40%.
One LinkedIn campaign, same 32,000-person audience, Sept 2023 to Feb 2024.
Over those six months, spend grew more than 13 times. The share of the audience reached did not. It moved between 24% and 67% month to month and settled near 40% overall.
What did change was frequency, which rose from about 1.6 to 7.6, and CPM, which rose from $52 to $154.
By the last two months the campaign had reached about as many people as it was going to reach with that message. The extra budget mostly paid to show the same people the same ads more often, at nearly three times the cost per thousand impressions.
That's not a reason to stop spending. It's a reason to know what the next dollar buys before you approve it.
Five checks before scaling paid social budget
When a client asks whether to put more money into paid social, we work through these in order.
- Is reach actually capped? If reach is below 30 to 40% of the ICP, or frequency is below 3 to 5 for prospecting or 7 to 9 for retargeting, there is room to grow. If both are at target, more budget will mostly raise frequency and cost.
- Is the channel sending ICP traffic to the website? The number of visits from target accounts is a useful proxy for whether a channel is reaching the right people, even before those accounts convert.
- What do direct-response conversions look like, in-platform and in the CRM? In-platform numbers are a signal where as CRM numbers are the truth. You should see some direct-response conversions even though paid social is a better brand preference channel.
- Is there influence and lift? Are accounts exposed to paid social moving through the pipeline faster, and converting at higher rates, than comparable accounts that weren't exposed? Chapter 13 covers how we measure this.
- What is happening to blended efficiency? Look at total paid spend against total pipeline. If spend went up and blended cost per opportunity improved, that is directional support for more budget, even when no single channel gets the credit.
If reach isn't capped and checks two through five look healthy, we usually recommend more budget. If reach is capped, the better move is often new creative, a new message, or a new segment, which opens up people the current campaign isn't reaching.
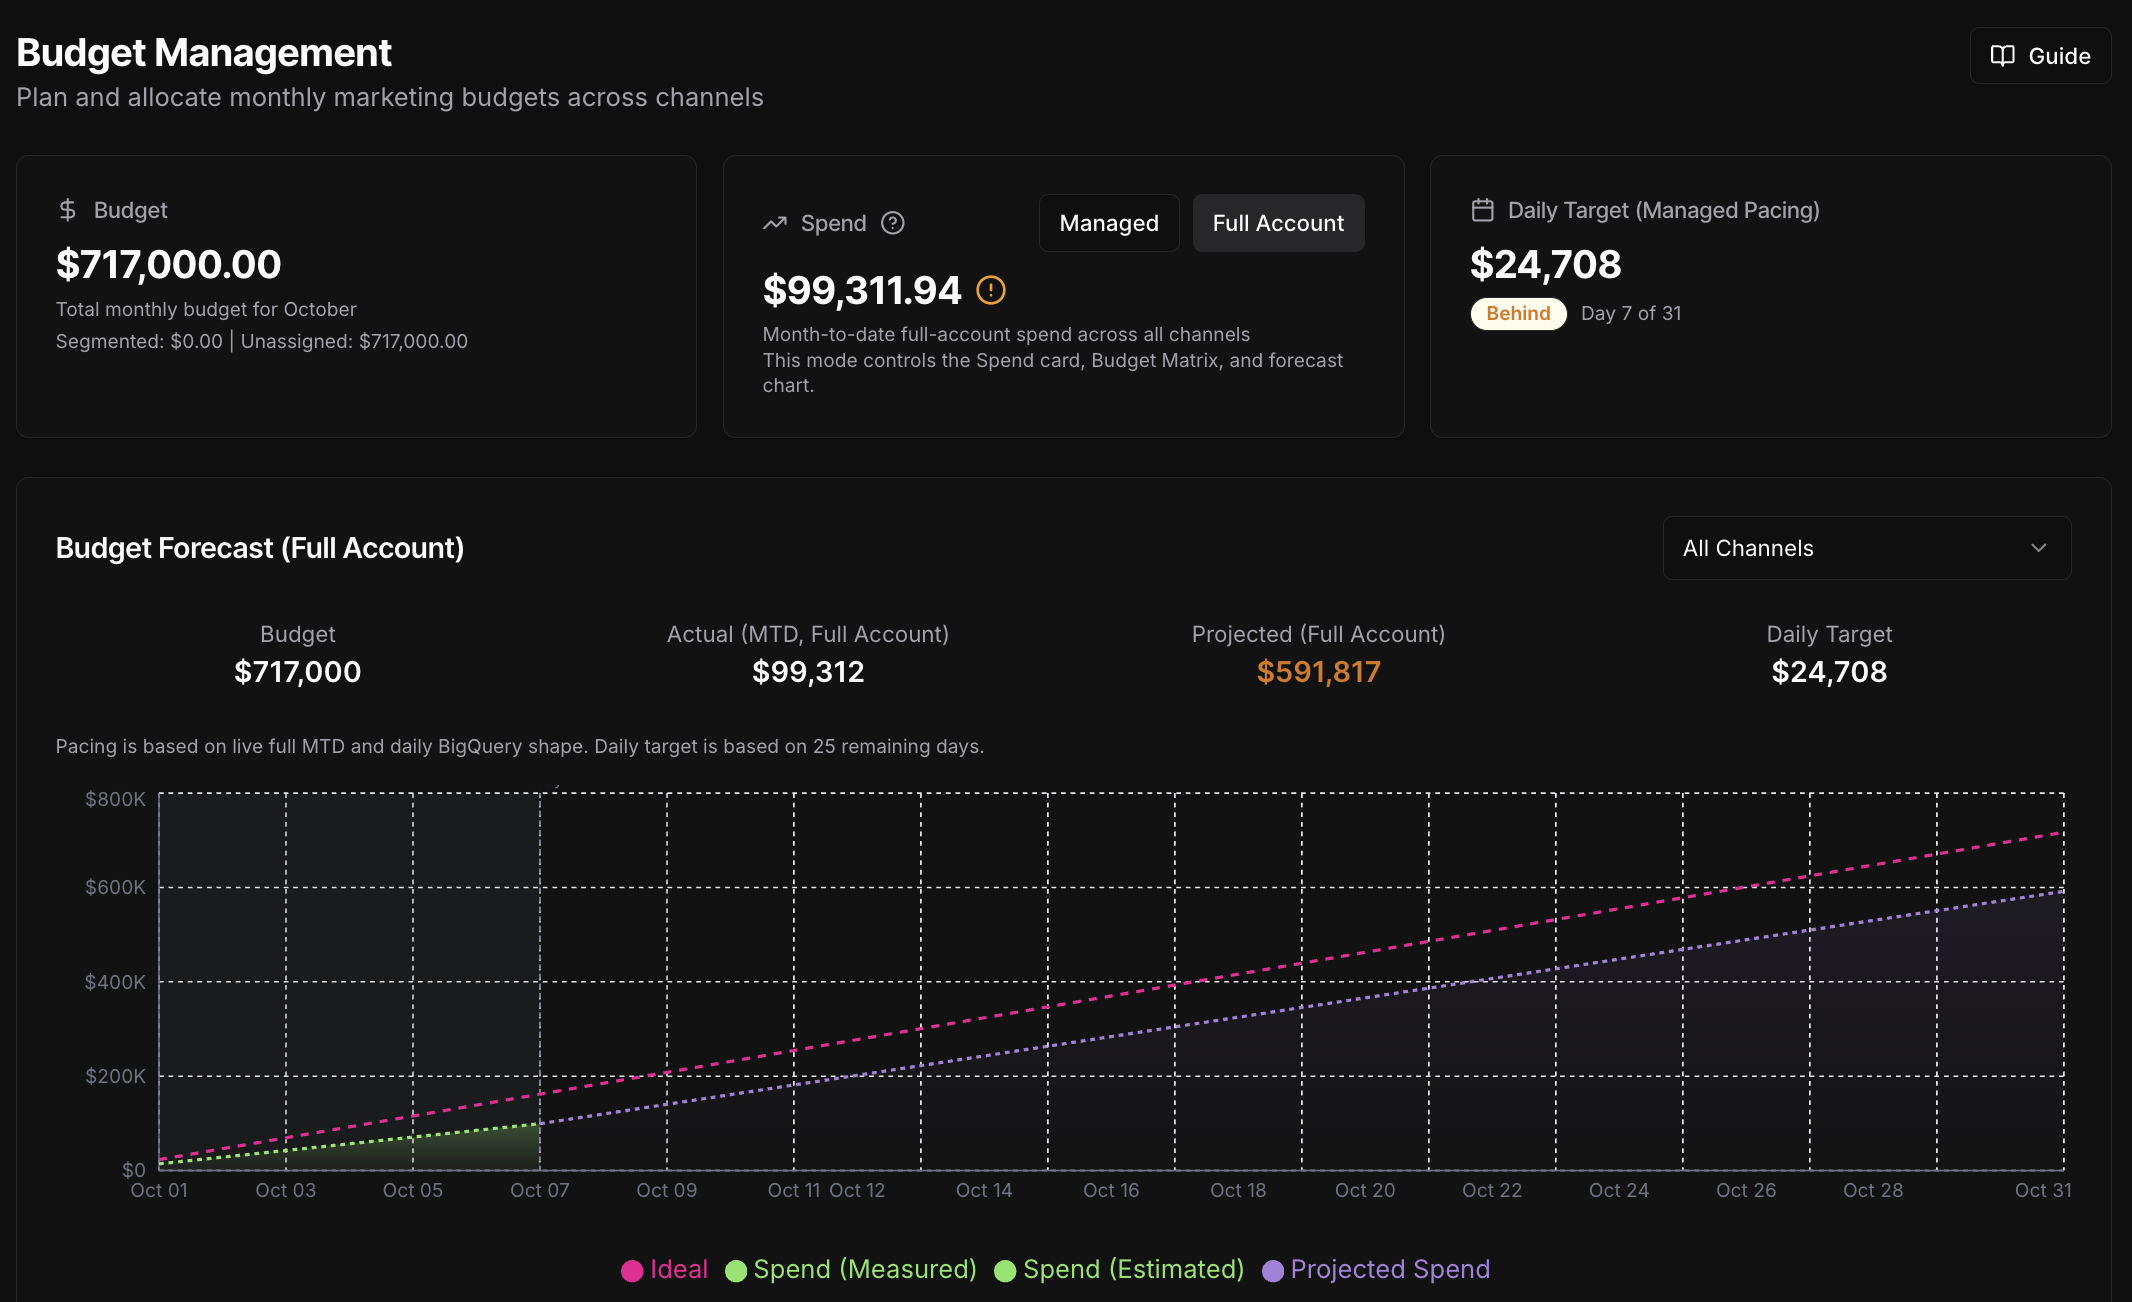
Internally, we run these checks in Omni OS. It shows spend to date, pacing, and projected month-end spend for every channel, updated throughout the day from the connected ad accounts. Its Influenced report shows how accounts reached by paid media compare with a fair comparison group. Together, those cover checks one, four, and five without anyone building a spreadsheet.
Omni OS · Budgets
How to talk about reach with a CFO
Very few CFOs want to hear that you reached 38% of your audience. They want to know what it means for revenue. So we translate leading indicators into business terms.

“If you try and measure organic social, or even paid social, in traditional attribution, it will always be at a loss. You'll always be losing money, and you're always gonna be sat there going, ‘How can I justify this spend?’”
| Instead of saying | Try saying |
|---|---|
| "Engagement rate is up 43%." | "We engaged 45 new accounts in our ICP that hadn't engaged with us before. Here they are. The more they engage now, the easier they will be for sales to convert later." |
| "Branded search clicks are up 20%." | "Branded search clicks are up 20%. At our 2% conversion rate from branded traffic, that is roughly 10 more opportunities over the next six months." |
| "We reached 38% of the ICP." | "Accounts we reached are converting to opportunities at a higher rate than accounts we didn't." |
Before approving more paid social budget, ask whether reach is capped. If it is, ask what new message or segment the extra money will open up. If no one can answer, the budget will mostly buy frequency.
Creative That Earns Attention
Reach gets your ad in front of a buyer. Creative decides whether they notice it, understand it, and remember who it was from. Most B2B creative fails on the last two, not the first.
Every ad has three jobs
- Be clear before you are clever. If a buyer can't tell what you do in a few seconds, the ad fails, no matter how good it looks. Calendly's "No more back and forth. Automate meeting scheduling." names the problem and the solution. A line like "Work smarter. Connect better." could belong to anyone.
- Link your brand to a buying situation. The Ehrenberg-Bass Institute calls these category entry points: the moments that prompt someone to think about a category. For Calendly, it is the annoying email chain of "does this time work?" Tie your brand to the moment, and buyers think of you when the moment happens.
- Look like you, every time. Distinctive brand assets, such as colors, characters, and visual styles, let buyers recognize you before they read a word. PostHog's hedgehog characters are a good example. Remove the logo and most people who know the brand still know whose ad it is. As Jenni Romaniuk of the Ehrenberg-Bass Institute puts it, the real objective is making sure buyers clearly link all of your marketing to your brand.
The four content types
We build every program from four types of content. They do different jobs, so we don't judge them on the same metric.
| Content type | Its job | Where it runs | How we judge it |
|---|---|---|---|
| Thought leadership | Take a position on a market problem and connect it to your brand narrative, without selling | Out-of-market layer | Reach, engagement, CTR, ICP traffic |
| Top-of-funnel education | Teach something useful about the problem, with proprietary data, templates, or real examples | Out-of-market layer | Reach, engagement, time spent |
| Product marketing | Show what the product does, how it works, and what changes for the buyer | Both layers | CTR, engagement, ICP traffic |
| Social proof | Customer stories, quantified results, third-party validation | Both layers, heavier in retargeting | Engagement, conversions, pipeline |
| Direct offers | Demos, assessments, incentives for warm accounts | In-market layer only | Leads, SQLs, pipeline |
Thought leadership does not have to come from your own executives. It can come from a partner, an investor, or a customer. What matters is that it comes from a person with an actual opinion.
Real examples from our work
- Anvilogic (detection engineering for security teams). IT leaders kept asking how to correlate threats across Microsoft and non-Microsoft sources. We built product marketing around that exact question, so Anvilogic became associated with the answer.
- Thoropass (compliance and audit). Buyers were frustrated by collecting evidence in one system and repackaging it for auditors in another. The headline said what they wanted: "Compliance and audits, finally in one place."
- Drata (compliance automation). For net new buyers, we paired a well-known customer logo with G2 validation, so a brand considering Drata could see it wasn't taking a risk.
- Submittable (submission and grant management). We told the story of how the Lindsey Vonn Foundation changed its grant process, turning a feature list into a story about a recognizable customer.
Four ads, four buying situations
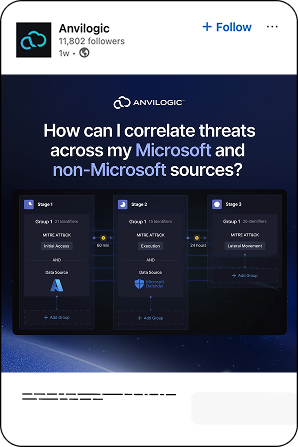
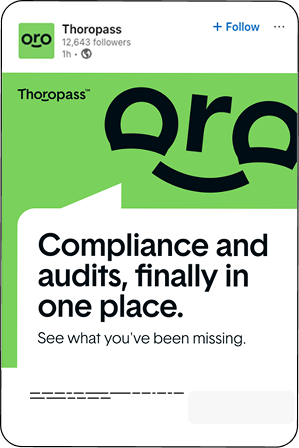
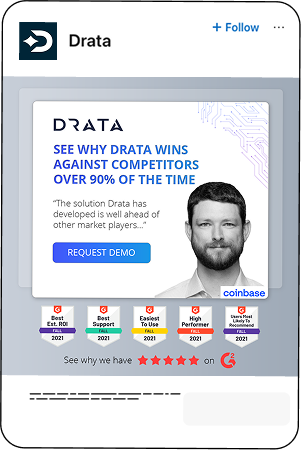

None of these ads tried to explain the whole product. Each one picked one problem, for one buyer, and said it plainly.
Say the same thing 100 ways
The goal of creative testing is not to find the single best ad. It is to find the few messages that work, then say them in as many different ways as possible: a visual analogy, a meme, a chart, a customer quote, a short video, a founder's post. I'd rather find three messages that work and say them ten different ways than keep hunting for one perfect ad.
This matters because B2B teams tend to get bored of their own ads long before buyers do. Research from System1 Group in 2023 found little evidence that strong ads wear out.
Ads that drew a strong emotional response could keep working for years, and in some cases performed better over time. Separately, the well-known Ebbinghaus forgetting curve suggests people forget about half of what they learn within days unless it is repeated.
The practical rule: keep good ads running longer than feels comfortable. Bring back winners from past quarters. And when you refresh, keep the message and change the execution.
Test on organic first
We avoid putting paid budget behind content that hasn't been tested anywhere. When possible, an idea goes out as an organic post from a real person first. If it earns engagement from the right people organically, it has a much better chance of working as an ad. It also fails the 30-second AI test from Chapter 3 less often, because people rarely engage with content they could have gotten from a chatbot.
A note on AI and creative
AI makes it easy to produce hundreds of ad variations. That's only useful if the message underneath is right. We use AI to draft and to speed up variation, but every concept starts from the ranked pain points in Chapter 6, and every ad is reviewed by people before it goes to the client for approval.
One message, five executions
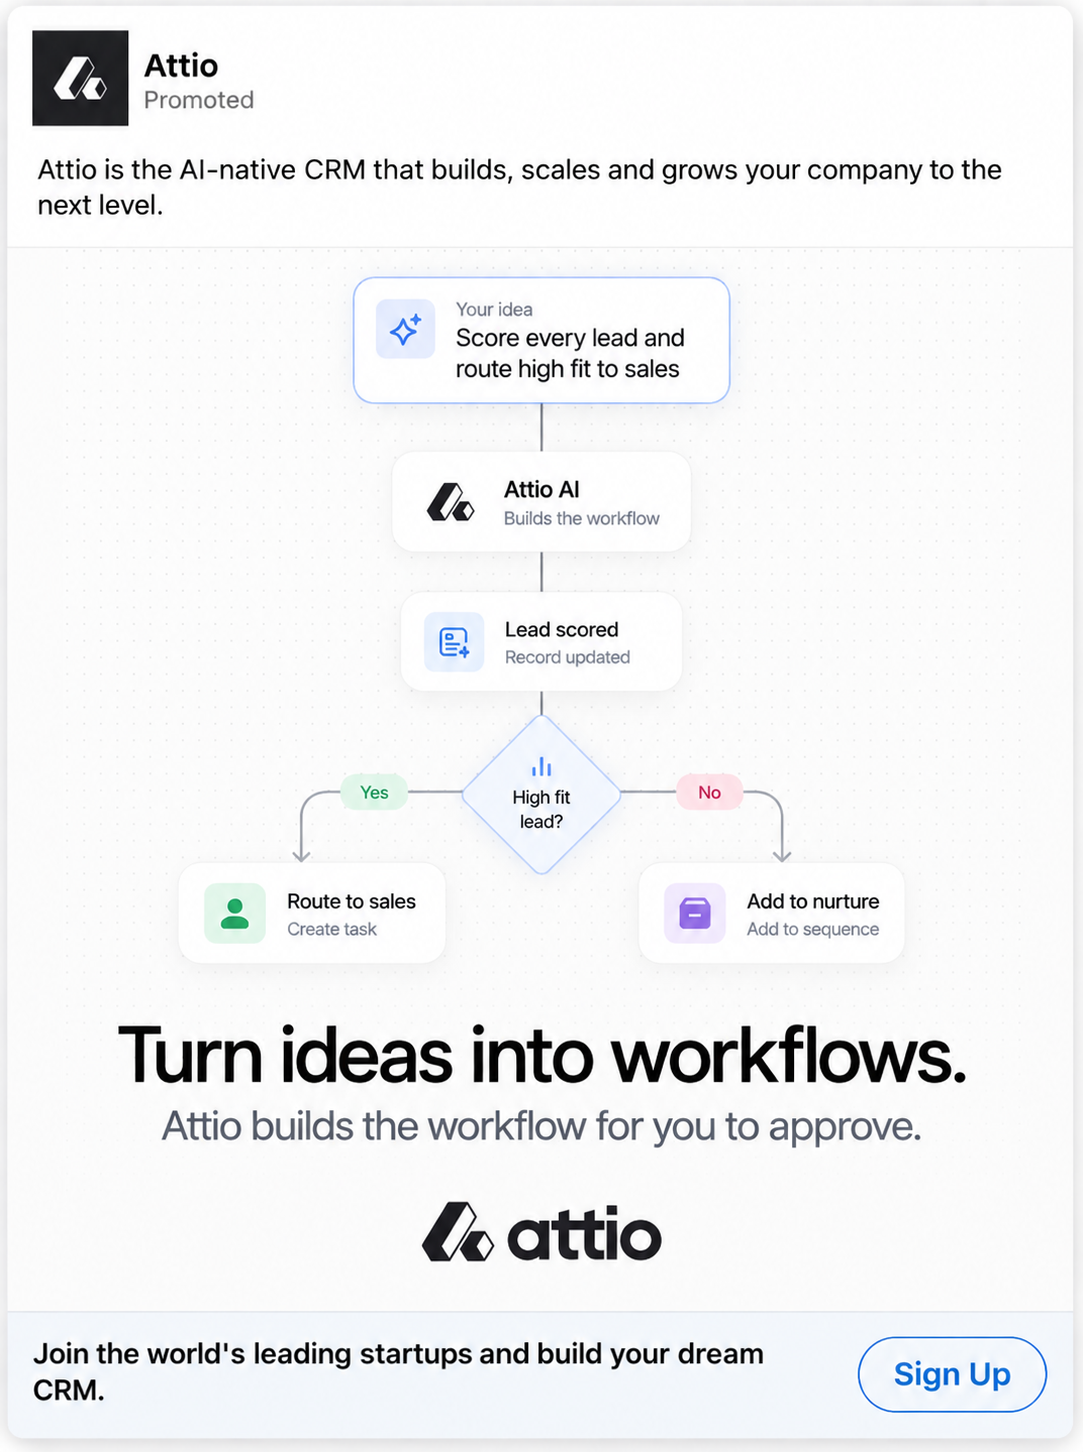
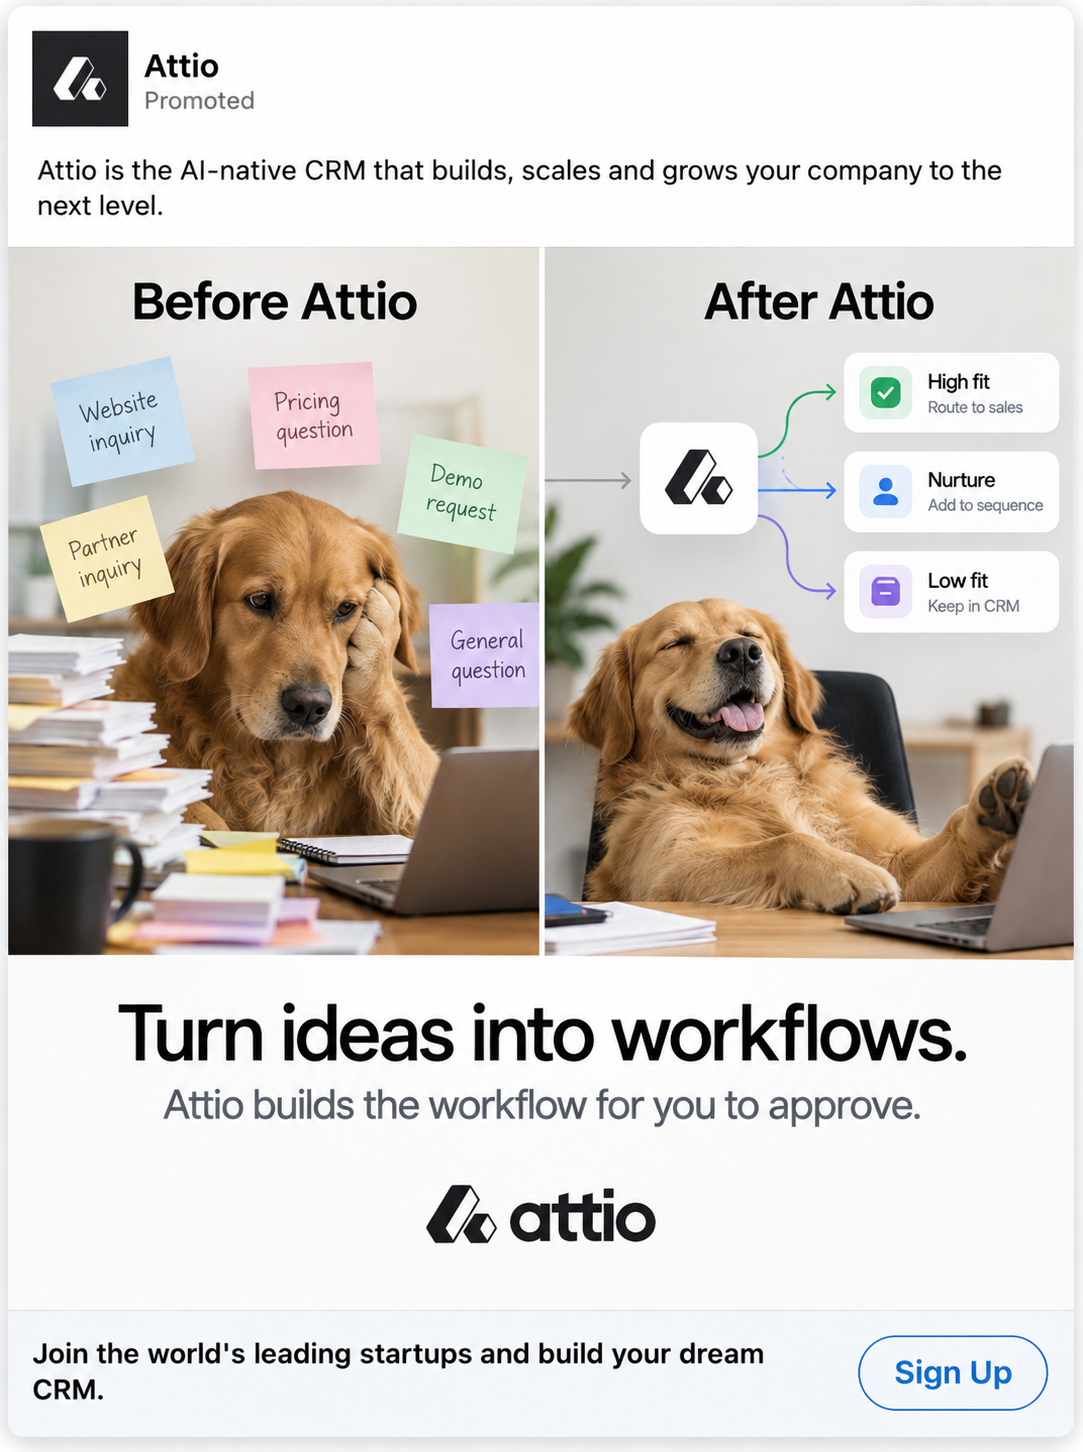
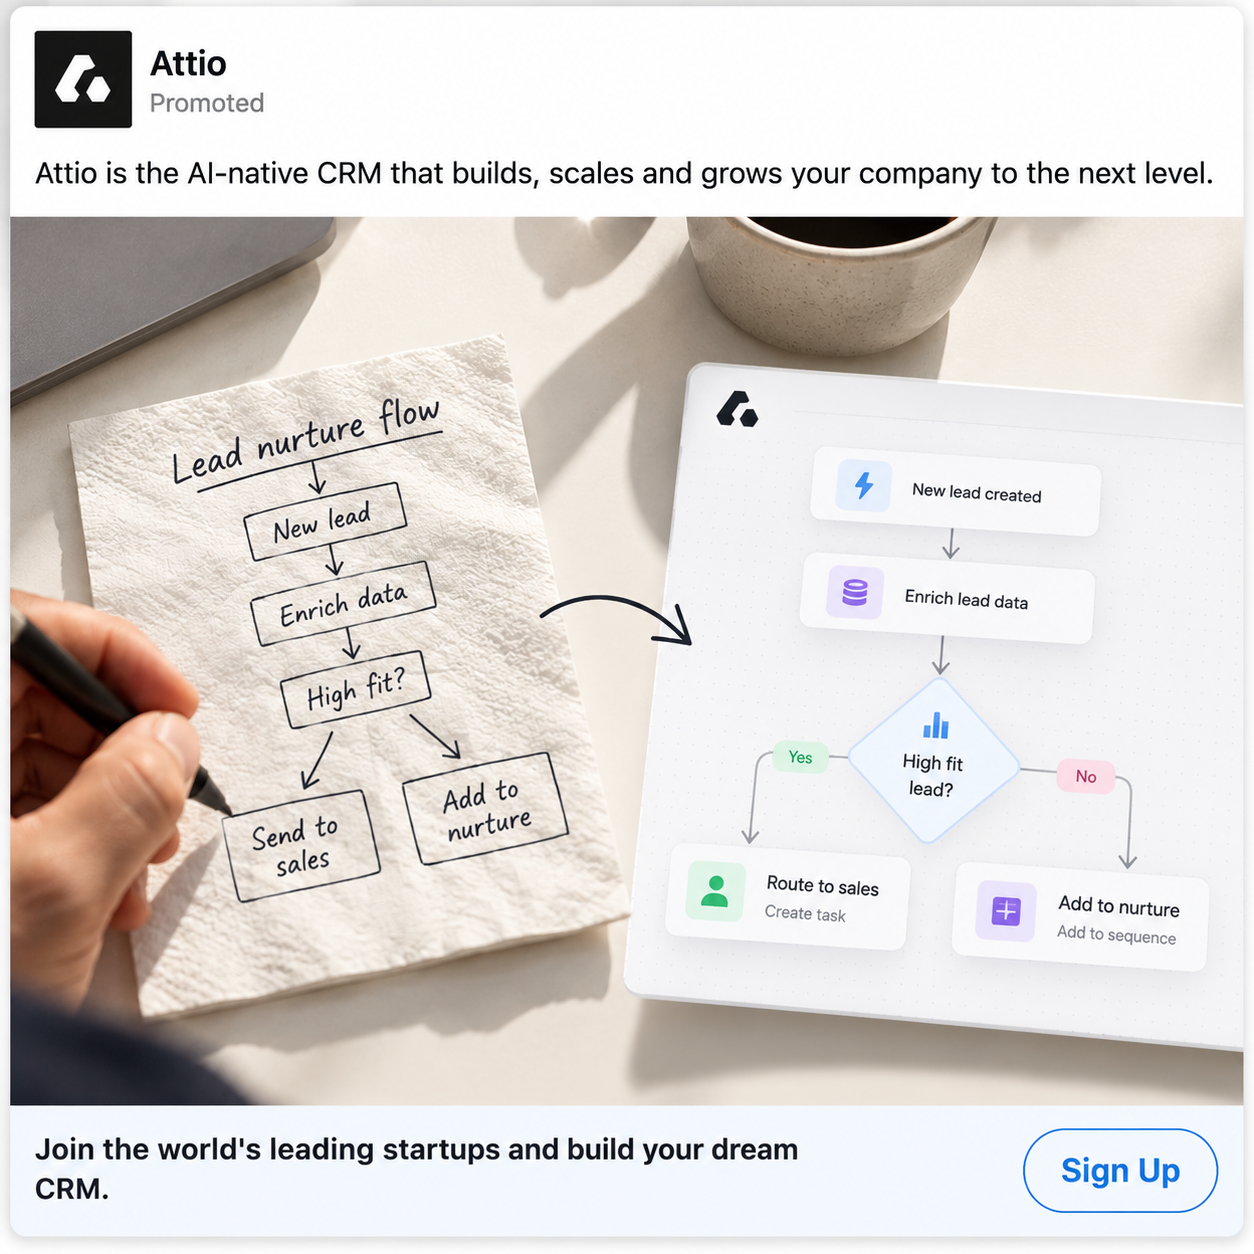
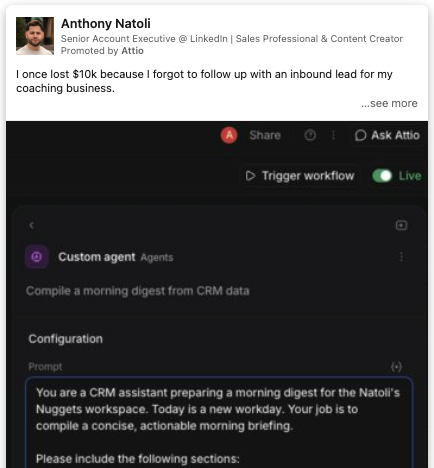
Pull up your last ten ads. For each one, ask: can a buyer tell what we do in five seconds, which buying situation does it tie us to, and would they know it was us without the logo?
If most answers are no, the creative is costing you more than the media.
Paid Search Captures the 5%
- Chapter 10Search Captures, It Doesn't Create
- Chapter 11Running Search for Pipeline
- Chapter 12How Social and Search Compound
Search Captures, It Doesn't Create
Paid search is the most efficient way to reach buyers who are already looking. It's not a way to make people look. Programs go wrong when they ask search to do the second job.
Search only reaches part of the awareness ladder
Go back to Schwartz's five awareness levels from Chapter 1. Search reaches the bottom three: buyers who know solutions exist, buyers who know your product, and buyers who are ready to buy. Unaware and problem-aware buyers either aren't searching or are asking informational questions that AI now answers on the results page (Chapter 3).
That gives search a clear job. Be present, and win, when a buyer with commercial intent goes looking. Everything about how we run search follows from it.
Organize spend around intent
We split every search account into separate campaigns by type of intent, then judge each one on its own terms.
| Campaign type | Who it reaches | What success looks like |
|---|---|---|
| Brand | Buyers searching for you by name | Owning 80%+ or more of available impressions; defending against competitors bidding on your name |
| Non-brand | Buyers researching the category with commercial intent | 30 to 40%+ impression share on the terms that matter; cost per opportunity trending down |
| Competitor | Buyers comparing you with, or looking for alternatives to, a named competitor | Cost per opportunity, judged separately because these buyers convert differently |
Across Omni Lab's Google and Microsoft Ads accounts from January to October 2026 (n=40), the three campaign types cost and convert very differently:
| Campaign type | Avg. cost per click | Conversion rate | Cost per conversion |
|---|---|---|---|
| Competitor | $13.69 | 9.08% | About $150 |
| Brand | $5.75 | 4.54% | About $125 |
| Non-brand | $18.08 | 1.84% | About $980 |
Conversion rate and cost per click by campaign type
A note on what "conversion" means here: we only count high-intent actions, demo requests and trial starts. Content downloads and newsletter sign-ups aren't included. Cost per conversion is cost per click divided by conversion rate.
A few things stand out. Brand is the cheapest conversion in the account, which is exactly why it tends to look so good in reports. Competitor campaigns convert at twice the rate of brand for a little more per conversion, because a buyer comparing you with a named alternative is close to a decision. Non-brand converts at under 2%, so each conversion costs nearly eight times what brand does. That's the real price of reaching buyers who don't know you yet, and it's the number that comes down when paid social has done its job (Chapter 12).
The reason for the split is business control, not neatness.
- Budget control. You decide how much to spend defending your brand and how much to spend winning new buyers, instead of letting the platform blend the two.
- Honest benchmarks. Brand search almost always looks cheap, because those buyers already chose you. Blended with non-brand, it hides how expensive new demand really is.
- No cannibalization. Without separation, cheap branded clicks can eat the budget meant for buyers who don't know you yet.
Each type is tracked to pipeline separately, through the CRM. When someone asks "is search working?", the honest answer is usually "brand is doing well, non-brand needs work, and competitor is too early to tell."
What a strong brand campaign can hide
In a recent audit of a Series D B2B SaaS account, one branded search campaign was driving 51% of the company's pipeline on 7% of its paid spend. That's the kind of number that ends up in a board deck as proof paid media works.
It raises two questions most teams never ask. First, would much of that pipeline have shown up anyway? People searching your company name already know you, and many would have clicked the organic listing right below the ad. Second, how much more is there? The campaign was already capturing about 87% of available impressions, so it had little room left to grow, and nothing else in the account was ready to take over.
The takeaway isn't to cut brand. It's to test whether that pipeline is truly incremental (Chapter 13 covers how), and to start building your next source of pipeline before your best campaign hits its ceiling. (Read the full analysis)
One brand campaign: 7% of paid spend, 51% of pipeline
Share of search spend, brand vs. non-brand
This is based off of 40 SaaS brands from January to October 7, 2026.
Focus on commercial intent, not volume
We concentrate non-brand budget on mid- to high-intent terms: buyers comparing tools, looking for software for a specific job, or researching pricing and alternatives. We deliberately deprioritize informational queries like "what is" and "how to." They bring volume, but they bring it at the top of the awareness ladder, and AI is taking more of those clicks every quarter.
Billd: fewer leads, better pipeline
Billd, a fintech company serving the construction industry, shows what holding the line on intent looks like. Its search program produced plenty of conversions, but a large share came from traffic that rarely moved through the funnel. We reduced bids on that traffic first, then excluded it entirely across Google and Microsoft Ads.
Conversions dipped, which we expected and the team accepted. Then lead quality rose and qualification rates followed. Over six months, cost per SQL fell more than 75% and SQL volume grew more than 4x, on consistent spend. Accepting a short-term dip in lead volume was the decision that made everything else possible.
Read the Billd case study →Quality Score is a keyword strategy problem
Google's Quality Score influences how much you pay per click. Most teams treat a low score as a copywriting or landing page problem. In our experience it is usually a keyword strategy problem first.
If broad match is pulling in informational queries, no ad copy will earn a strong click-through rate on them, because the people searching aren't looking to buy. Fix which searches you show up for, and ad relevance, CTR, and cost per click usually improve together. Copy and landing pages matter, but they come second.
A pattern we see when inheriting accounts
A common scenario when we take over an account: a large share of non-brand spend is going to broad match terms that pull in informational searches. Leadership's instinct is to pause everything that isn't converting.
We usually advise against an abrupt pause. Pausing at once can starve the campaigns of data and cause performance to drop before it recovers. Instead, we layer in tighter targeting step by step, exclude irrelevant searches as they appear, and shift budget toward the terms producing opportunities. It is slower, but it protects pipeline while the account gets cleaner.
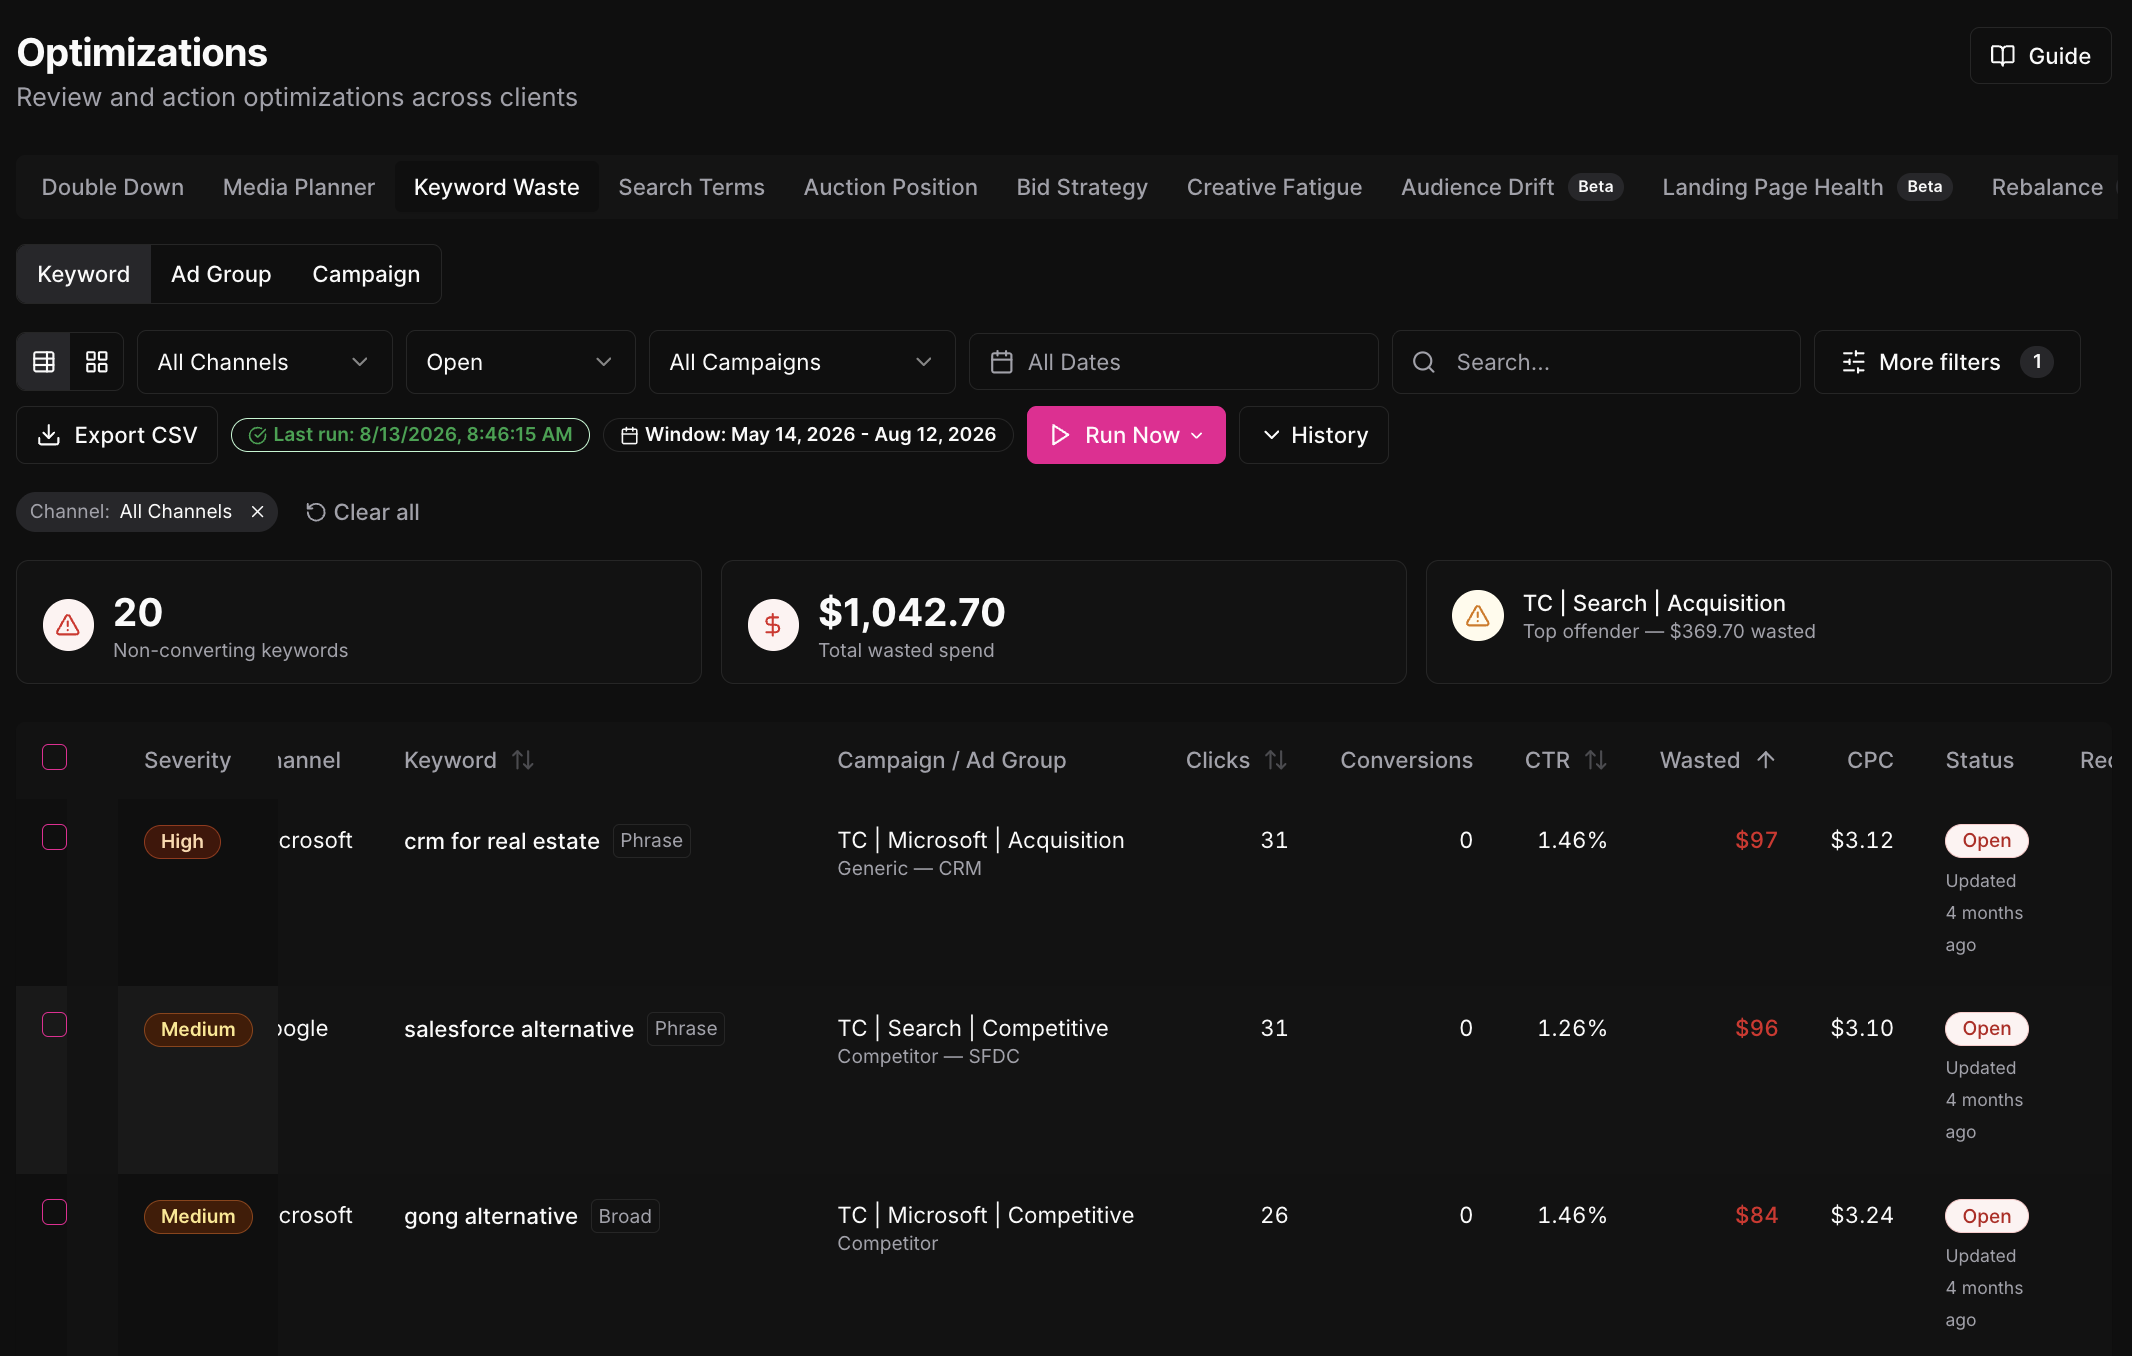
Wasted search spend rarely announces itself. It accumulates a little each day in terms no one is reviewing. Internally, we use Omni OS to catch it. It flags keywords that exceed a spending or cost-per-lead threshold without converting, and flags search terms that don't fit the brand or the intent we're targeting, across Google and Microsoft Ads. Our team reviews those flags and acts on them each week, so the leak gets found in days rather than at the end of the quarter.
Omni OS · Optimization
Questions to ask your search program
- Are brand, non-brand, and competitor campaigns separated, each with its own budget and its own cost per opportunity?
- What share of non-brand spend goes to informational searches, and what pipeline has it produced in the last six months?
- What is our impression share on brand terms, and who else is bidding on our name?
- When we lose impressions on non-brand, is it because of budget or because of ad rank? Only the first one is solved by spending more.
Judge search on how well it captures demand from buyers who are already evaluating, not on how much demand it generates. If search is expected to fill the whole pipeline on its own, it will get more expensive every year, because it depends on preference that something else has to build.
Running Search for Pipeline
Ad platforms optimize toward whatever you tell them is a conversion. If that is a form fill, they will find you more form fills, including ones your sales team will never touch. Connecting the CRM back to the ad platforms is the biggest single fix most search programs can make.
Why in-platform conversions mislead
A demo request is a leading indicator. It tells you someone raised a hand. It doesn't tell you whether they were in your ICP, whether they showed up, or whether they became pipeline.
When the only signal the platform receives is the form fill, its bidding algorithms learn to find more people who fill out forms. In B2B, that can mean students, job seekers, and very small companies. In-platform cost per lead looks great. The sales team says the leads are bad. Both are right.
We see this clearly in how search ads get matched to searches. Broad matching lets Google show your ad for anything it judges related to your keyword. Exact matching keeps it tight.
In one audit of $1.3M in search spend traced through the CRM, broad matching produced the cheapest MQLs in the account. Those leads then converted to SQL at roughly a third the rate of tighter matching, and exact matching returned about 4x the pipeline per dollar.
The lesson isn't really about match types. The cheapest lead and the most valuable lead are rarely the same, and whatever your team is measured on will decide which one your program buys. (Read the full analysis)
Broad wins on cost per MQL and loses on everything after it
Closing the loop
We connect paid search to pipeline in four steps.
- Fix tracking. Audit every tag, pixel, and form submission, and repair what is broken. As Chapter 5 noted, most new accounts need this.
- Send CRM milestones back to the platforms. When a lead becomes an MQL, an SQL, an opportunity, or closed-won in Salesforce or HubSpot, that event is passed back to Google Ads and Microsoft Ads as an offline conversion.
- Report from the CRM. Build a view that shows MQL volume, SQL conversion rate, pipeline created, cost per first meeting, and cost per opportunity by channel and campaign.
- Align with attribution. Work inside whatever model the company already accepts, whether that is first touch, last touch, or a multi-touch tool, so paid search is credited the same way as everything else.
The closed loop
Once that's in place, the platform learns from what sales values, and the team can see which campaigns produce opportunities rather than which produce leads.
Internally, we do this in Omni OS, which syncs directly with Salesforce and HubSpot. The client's funnel stages and targets live alongside actual results, so the team sees cost per MQL, SQL, and opportunity by channel against target without waiting for a monthly report. The Attribution view lets teams switch between first-touch, last-touch, and multi-touch credit to see how the story changes under each.
Judge search on cost per opportunity
We judge search on cost per opportunity, or cost per qualified meeting where opportunity volume is too low to read, not on cost per lead. The two often tell opposite stories. A campaign with a high cost per lead can be the most efficient source of pipeline in the account. A campaign with a low cost per lead can produce none.
Thoropass: what the CRM showed that the dashboard couldn't
Thoropass, a compliance and audit platform, came to us with real coverage across Google and Microsoft Ads. But every conversion signal stopped at the form fill, and budget followed in-platform numbers that sales couldn't reconcile.
We wired MQL, SQL, and SAL events back into the ad platforms and checked every campaign against Salesforce. Some high-spending campaigns had produced no pipeline at all. Others, with expensive-looking cost per lead, were generating real revenue. We paused the first group, protected the second, and added budget only where cost per SAL earned it.
In one quarter, paid SQLs more than doubled, paid MQLs grew more than 55%, and pipeline contribution grew more than 40%. The blended conversion rate rose about 70% even as clicks and impressions fell. None of it came from a new channel. It came from finally seeing clearly.
I won't pretend this is easy. Pausing campaigns that look good in a platform dashboard is uncomfortable, and I've felt that pressure myself when a client needs to hit a lead number this month. It only works when leadership agrees beforehand that pipeline, not leads, is the measure.
Read the Thoropass case study →Ask which conversion event your search campaigns are optimizing toward today. If the answer is a form fill, and no CRM milestones are flowing back to the platforms, that is the first thing to fix. It is usually worth more than any new campaign.
How Social and Search Compound
Paid social and paid search are usually budgeted, staffed, and reported as separate channels. They work best as one system. Social builds the preference that search later captures, and search tells social which messages buyers actually respond to.
Social makes search cheaper
When a buyer who has seen your thought leadership for six months finally searches the category, three things are more likely. They search for you by name, which costs less than a category term. They click your ad over a competitor's, because they recognize you. And they convert once they land, because they already trust you.
None of that shows up in social's last-click numbers. It shows up as stronger branded search volume, better non-brand conversion rates, and lower cost per opportunity in search. That's why cutting the out-of-market layer to fund more search tends to backfire a few quarters later, as Chapter 4 described.
Search tells social what to say
The flow runs the other way too. The keywords that produce opportunities in search tell you which problems buyers are actively trying to solve, and in their own words. Those are strong candidates for social messaging. Search queries that keep showing up, even when they don't convert, can reveal buying situations your creative hasn't addressed yet.
Give each channel the job it is suited for
| Paid social | Paid search | |
|---|---|---|
| Primary job | Build preference with the 95%; fill and convert warm pools | Capture buyers already evaluating |
| Judged on | Reach, frequency, engagement, influenced pipeline, then direct conversions in retargeting | Cost per opportunity, impression share, pipeline |
| Fails when | Judged only on cost per lead | Asked to generate demand that doesn't exist yet |
In practice, most budgets don't follow that split. Across the accounts we manage, nearly two-thirds of paid spend goes to Google. That isn't because search is the right job for most of the budget. It reflects how teams are incentivized, the last-click measurement most companies have accepted, and targets set on a quarterly timeline, all of which reward the channel closest to the conversion.
Share of paid media spend by channel
This is based off of 40 SaaS brands from January to October 7, 2026.
Case study: a 65% drop in cost per opportunity
The company: a PE-backed software company selling to digital signage and digital out-of-home buyers. Sales-led motion, two lines of business, and an annual contract value of $25K to $50K. Pipeline was the metric that mattered.
The problem: cost per opportunity had climbed to $4.6K. Google carried roughly 80 to 90% of the budget, LinkedIn most of the rest, with small tests on Meta and Microsoft Ads. Inside a search account that looked healthy, several keyword themes built on broad industry terms sounded relevant but had produced zero conversions for months. Meanwhile, LinkedIn and Meta were being asked to do two jobs at once: stay visible to a slow-moving buying committee, and hit a direct-response target they were never set up to hit.
What we did in search: we paused the keyword themes that had converted at zero, kept tightening the account around genuine buying intent, and shifted bidding to favor the conversions worth the most rather than the most clicks. New landing pages for each line of business, and separate campaigns for the US and international markets, sharpened the match between message and page.
What we did in social: we stopped judging LinkedIn and Meta as conversion channels and ran them for reach, engagement, and influence. Creative was refreshed on a regular cadence, with case studies and social proof added to the rotation. Targeting moved from narrow, expensive account lists to broader native LinkedIn targeting, trading some precision for scale and lower cost. We also started a thought leader test to see whether a credible internal voice would outperform brand-only messaging.
What happened: between May and August, cost per opportunity fell from $4.6K to $1.6K, a 65% reduction, on a consistent level of spend. Over the same period, LinkedIn was associated with $3.87M in influenced pipeline: deals at accounts that had meaningful exposure to LinkedIn ads before the opportunity was created. Judged on clicks and form fills alone, social would have looked weak. Judged on the job it was given, it was doing its work.
The takeaway: none of this came from a bigger budget. It came from giving each channel a job that matched what it is good at, and measuring each one against that job.
Ask to see your search and social results in the same review, side by side, with branded search trends included. If the two channels are reported by different people, on different metrics, in different meetings, you are probably under-crediting social and over-crediting search.
Measurement and Discipline
- Chapter 13Measure Account Progression, Not Stage Handoffs
- Chapter 14Discipline When Change Gets Cheap
Measure Account Progression, Not Stage Handoffs
If buyers loop, stall, and come back months later, stage conversion rates will always undercount what paid media does. The question that holds up is simpler: do the accounts we reach move through the pipeline faster, and convert more often, than comparable accounts we didn't reach?
Three signals, in order of trust
We build the story from three signals.
- The CRM is the primary signal. Cost per MQL, SQL, opportunity, and revenue, measured in Salesforce or HubSpot. This is the source of truth for pipeline and revenue.
- Platform metrics are directional. Reach, frequency, and engagement for social. Click-through rate, impression share, and cost per qualified lead for search. They tell us whether targeting and creative are working, month to month. They are signals, not proof.
- Buyer journey tools add depth when available. Multi-touch attribution platforms such as Dreamdata and HockeyStack, and incrementality tools such as Paramark, show the many touches across a long journey and support lift tests. Omni OS can answer some of these questions, albeit, we aren't positioning ourselves as a full attribution platform.
It'd be great if you could use one single attribution model, but the reality is different attribution models answer different questions.
it's about leveraging multiple different models and pieces of data to form a conclusion and a narrative to your executive team.
Influence: was paid media part of the journey?
Last-touch attribution gives paid social almost no credit, because buyers rarely click a LinkedIn ad and book a demo in the same session. Influence reporting asks a different question: did the companies that became opportunities and customers see, engage with, or click our ads beforehand?
We report influence across LinkedIn, Google Ads, and Microsoft Ads. The method has four parts.
- Match companies. Ad activity is matched to CRM companies by exact company identity first, then website domain, and company name only as a cautious fallback. Each match carries a confidence level.
- Set a threshold. A deal counts as influenced only if the buying company showed enough paid activity beforehand. The threshold can be based on exposure, on engagement such as likes, comments, and follows, or on clicks, and it can differ by channel.
- Look back far enough. For each deal, we check paid activity in the 12 months before it, because B2B journeys are long.
- Show the company timeline. For any account, ad touchpoints and deal milestones sit on one timeline, so sales and marketing can see how they line up.
Influence shows that paid media was part of the buying journey. It does not claim an ad was the sole cause of a deal. That distinction matters, and we hold ourselves to it in language: influenced pipeline is "associated with" paid media, not "generated by" it.
Omni OS · Influenced report
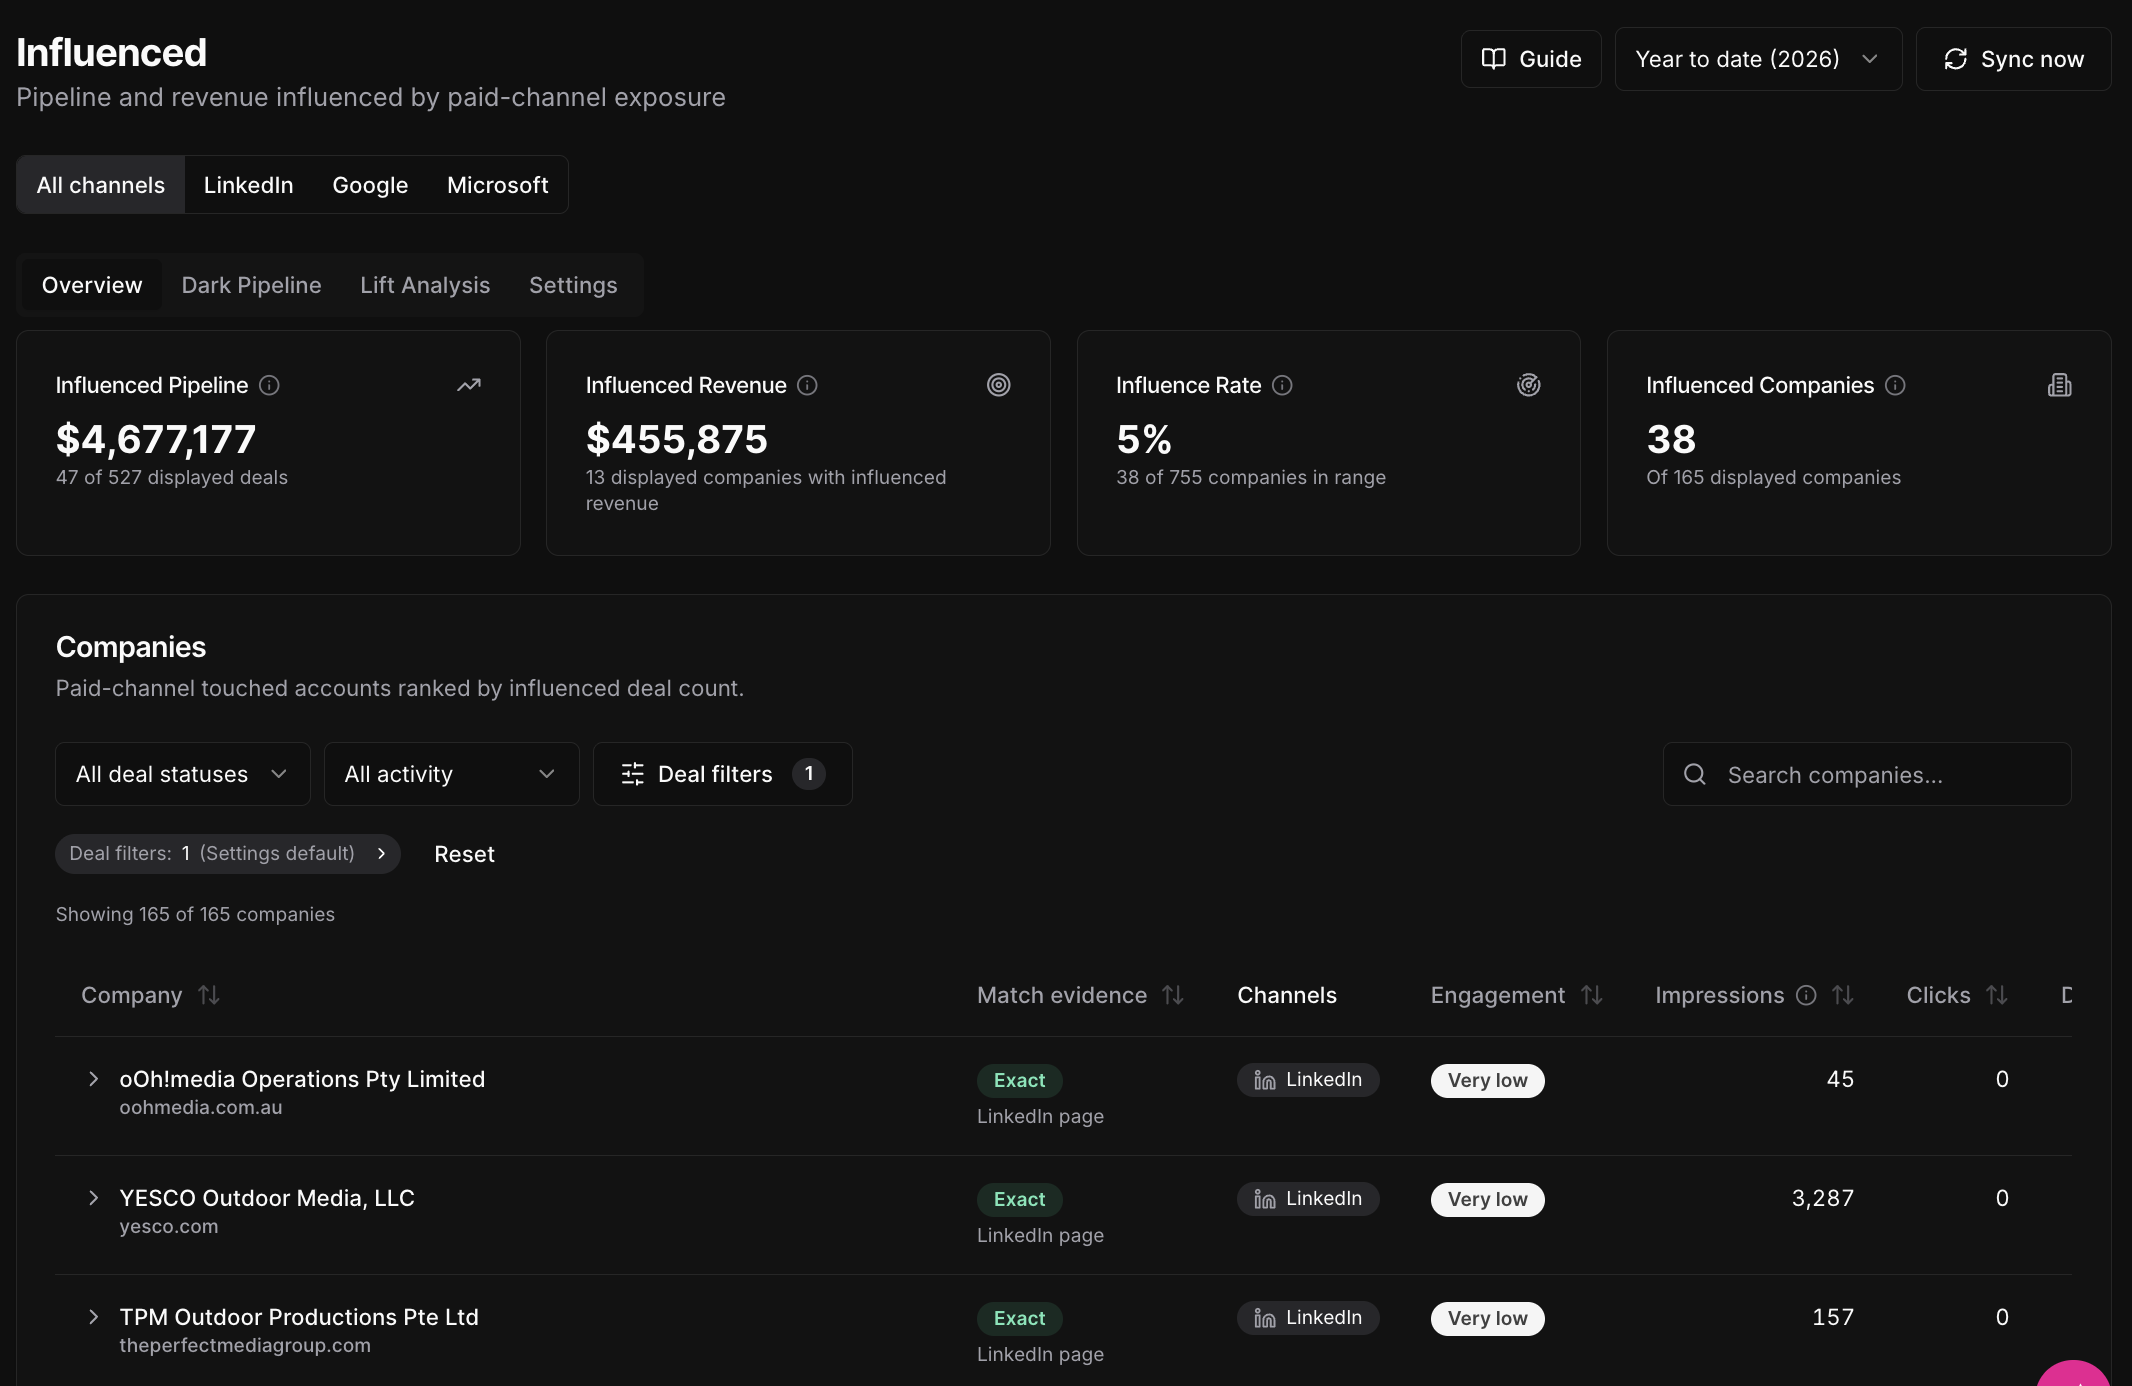
Lift: did reached accounts actually perform better?
Lift is the fairness test. It compares three groups.
| Group | Who is in it | Used in the comparison? |
|---|---|---|
| Reached | Companies that met the influence threshold | Yes |
| Comparable | Companies paid media could have reached, but that didn't meet the threshold | Yes |
| Not comparable | Companies paid media had no way to reach in the period | No, shown for transparency only |
We then compare close rates, typical deal value, and sales cycle length between the first two groups. Deal value uses the median rather than the average, so a single large deal can't skew the result. Every comparison carries a confidence label based on sample size: strong, directional, or low. A "directional" result is still useful. It just shouldn't be presented to a board as proof.
If you don't have a lift report yet, start with the simple version. Nick Turner, CEO of Dreamdata, put it plainly when he joined me on The Demand Podcast:

“Look at the conversion rate. If marketing was involved in this deal, what was the conversion rate? If it had no involvement, what was it there? It becomes pretty obvious what's most effective.”
That comparison takes an afternoon in most CRMs, and it often settles the argument faster than any attribution debate.
Omni OS · Influenced report, Lift Analysis
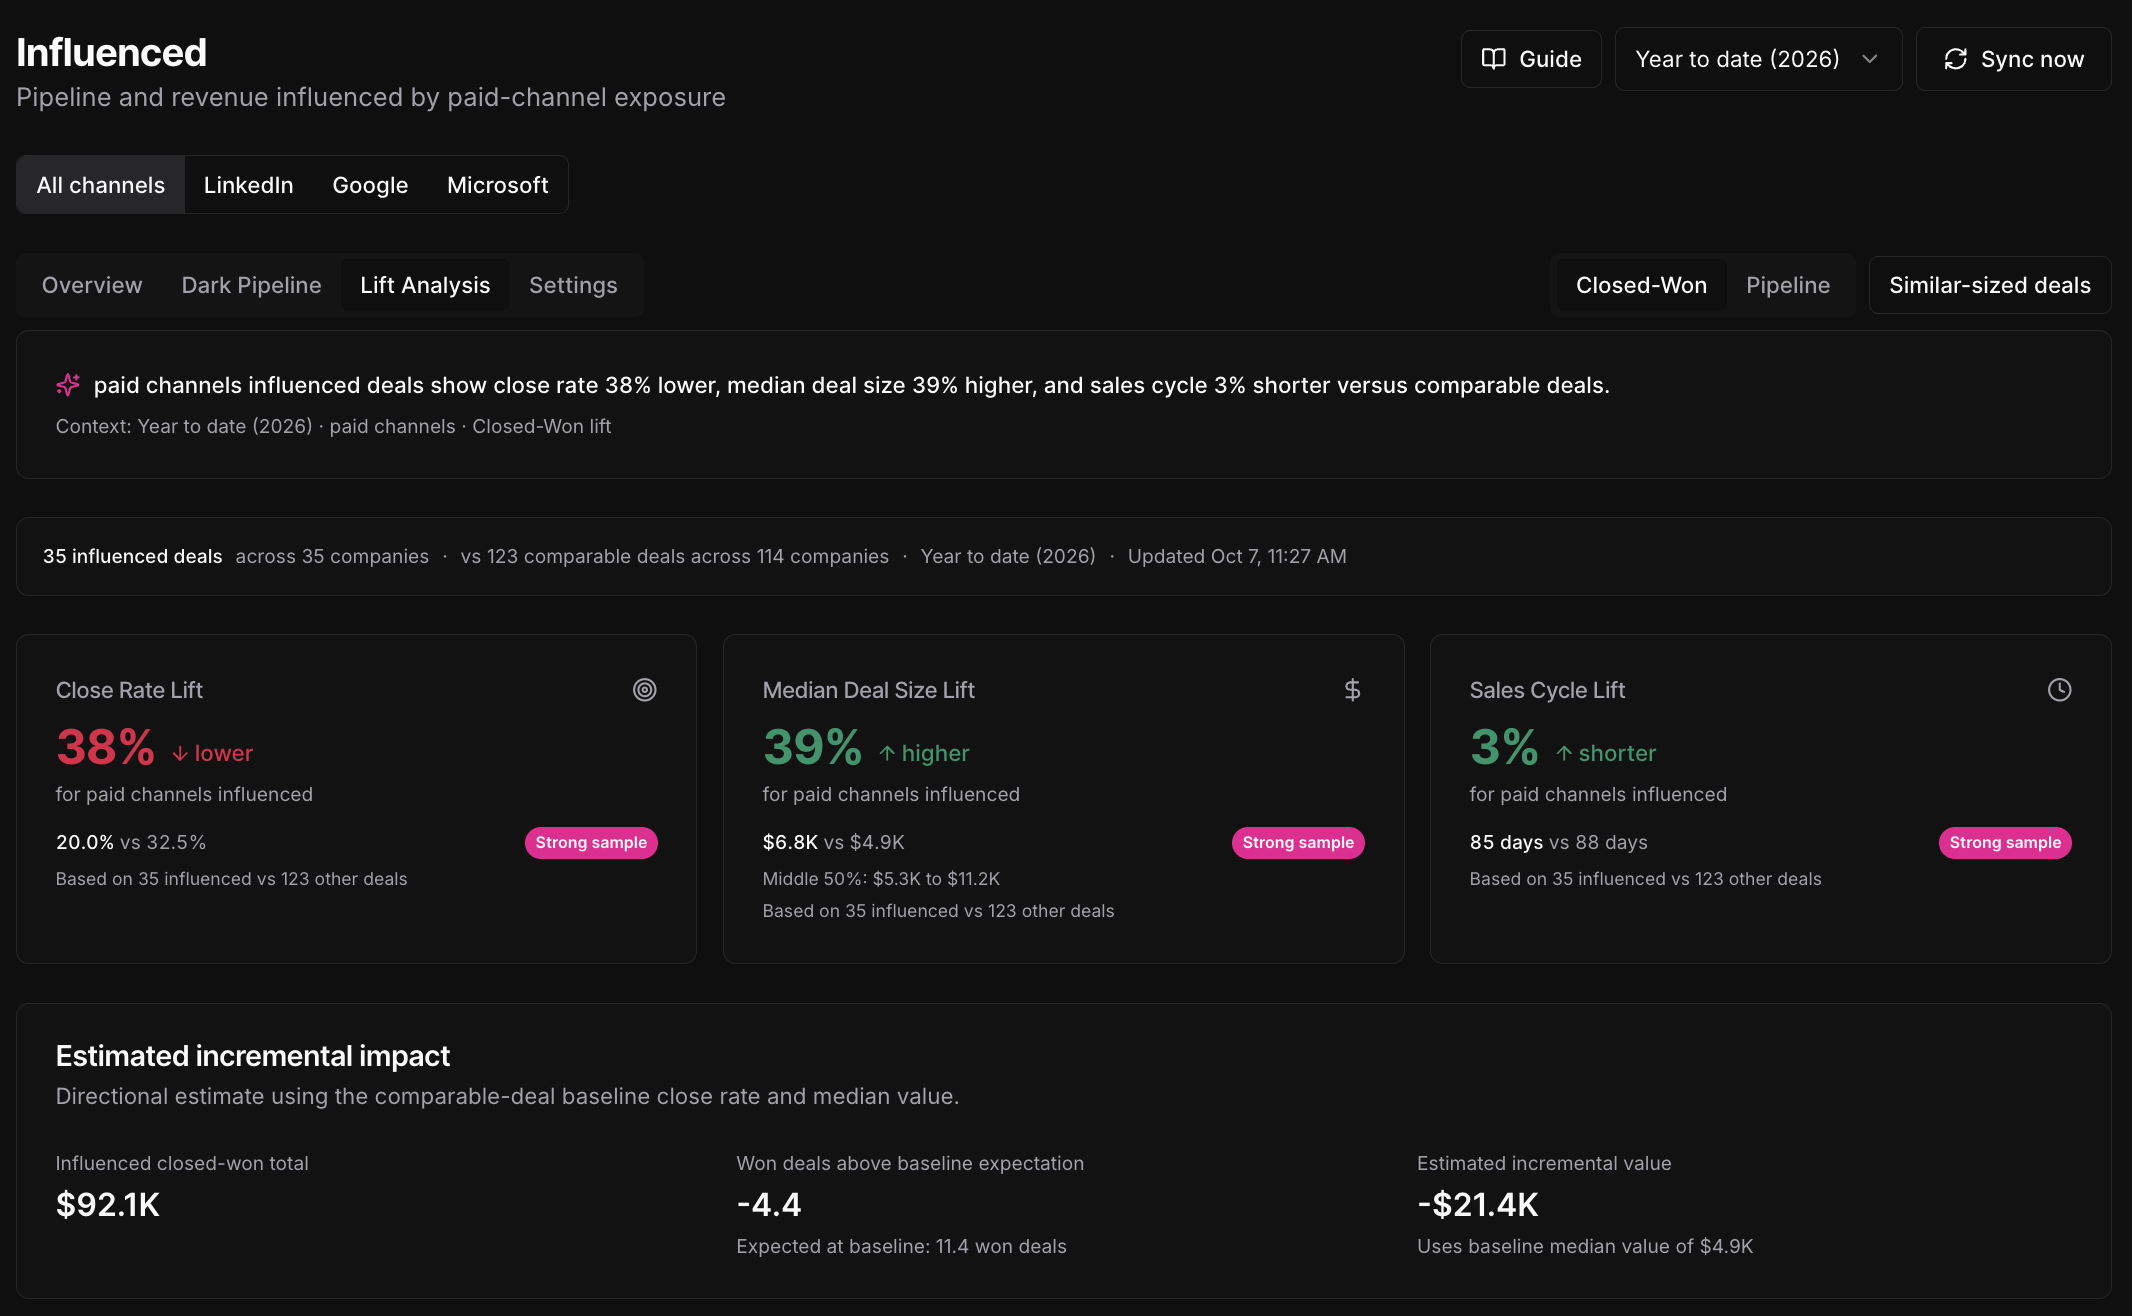
The same view also shows what we call dark pipeline: companies showing real engagement with paid media but with no deal in the CRM yet. That list is often more useful to sales than any lead report.
Incrementality: moving from correlation toward cause
Influence and lift show strong association. For clients with enough volume, incrementality tests get closer to cause. In order of rigor, the methods we use are:
- Geographic holdouts. Run in some regions and hold back in comparable ones, then compare pipeline.
- Alternating periods. Switch spend on and off in a planned pattern and compare the periods.
- Bid-down tests. Reduce investment in a controlled way and measure what is lost.
All three are more rigorous than the most common approach, which is pausing brand spend for 30 to 60 days and seeing what happens. That approach mixes in seasonality, sales activity, and everything else changing at the same time. Before any test launches, we agree with the client on the KPI, the method, and which business decision the result will inform.
Report so the CFO can follow it
Our monthly reports lead with lagging indicators (pipeline and revenue against target), then leading indicators by channel, then what we tested and learned. Quarterly reviews step back to progress toward the End State and the balance between demand capture and brand development. Narrative first, data second. A report should point to what's worth talking about, not print every number.
Internally, we run influence and lift through the Influenced report in Omni OS. It refreshes nightly from the ad platforms and the CRM and covers LinkedIn, Google Ads, and Microsoft Ads.
Omni OS also flags anomalies as they happen, such as overspend, a sudden CTR decline that signals creative fatigue, or an unexpected change in conversions, so issues are caught in days instead of at month end. Every flag is reviewed by our team before any action is taken.
Stop asking whether paid social generates leads. Ask whether accounts reached by paid media convert more often, close bigger, or close faster than comparable accounts that weren't. That question survives a loop. Stage conversion rates don't.
Discipline When Change Gets Cheap
Most paid programs don't fail from a lack of ideas. They fail from too many changes made too quickly to learn anything. AI makes changes faster and cheaper, which makes discipline more important, not less.
Separate testing from maintenance
We split everything we do into two kinds of work.
Routine optimization keeps a program healthy: refreshing ads within existing messages, pacing budgets, refining audiences, and excluding irrelevant search terms. These don't need approval, but we tell clients what we changed. Anything we believe could materially affect performance is raised before we do it.
Impact tests are how a program learns. We run one to three per channel per month, and each one follows the same steps.
- Choose. Pick the question with the biggest payoff, usually tied to the diagnosis or the End State. For example: "Do Thought Leader Ads produce more pipeline influence than standard company ads?" or "Can a new audience approach cut cost per opportunity in search by 20%?"
- Agree. Share the hypothesis, the KPI it will be judged on, and the timeline. Get explicit approval before building anything.
- Build. Create only the creative, audiences, or campaigns the test needs.
- Launch. Link the campaigns to the test so results are tracked automatically.
- Wait 30 to 45 days. No strategic changes to the campaigns in the test. Routine maintenance continues around it.
- Report. Share the result, whether a win, a loss, or inconclusive, in the monthly recap, tied to pipeline where possible.
- Repeat. Scale what worked, record what didn't, and choose the next test.
Step five is the hard one. A test that is changed after ten days because the early numbers looked soft has produced noise, not a result.
Miter: patience as a strategy
Miter sells payroll and workforce software to construction and field service companies. Once we connected pipeline events to Google and Microsoft Ads, the temptation was to switch on the most aggressive automated bidding right away. We didn't. Campaigns moved to more automated bidding in stages, only as enough downstream data built up to support each step. Budget followed one rule: campaigns hitting the cost-per-SAL target got more, and the rest were held flat or restructured.
It wasn't a straight line. One month underperformed while data accumulated, and the next month improved because of it. Over 90 days, monthly SALs roughly doubled, and SQLs held near record levels for three straight months. As the team put it at the time, patience compounds results.
Read the Miter case study →When someone asks "can we try X?"
New ideas arrive constantly: a new channel, a new format, a competitor's tactic, a board member's suggestion. We run every one through three questions.
- Does it fit the diagnosis and the ICP?
- Does it serve demand capture or brand development?
- Can we test it properly before scaling it?
If the answer to all three is yes, it becomes a structured test. If not, we explain why and suggest an alternative. That's how a program can say yes to good ideas without being pulled in a new direction every month.
The same discipline applies when performance dips. Before changing anything, we check three things in order. Do the time period and KPI being compared match? Is execution on target: search terms aligned with keywords, and ads meeting benchmarks? Is the program reaching the right audience at the right frequency, with enough variety in its content? If execution checks out, the issue may be the market or the message, and that calls for a conversation, not a scramble.
Omni OS · Impact Tests
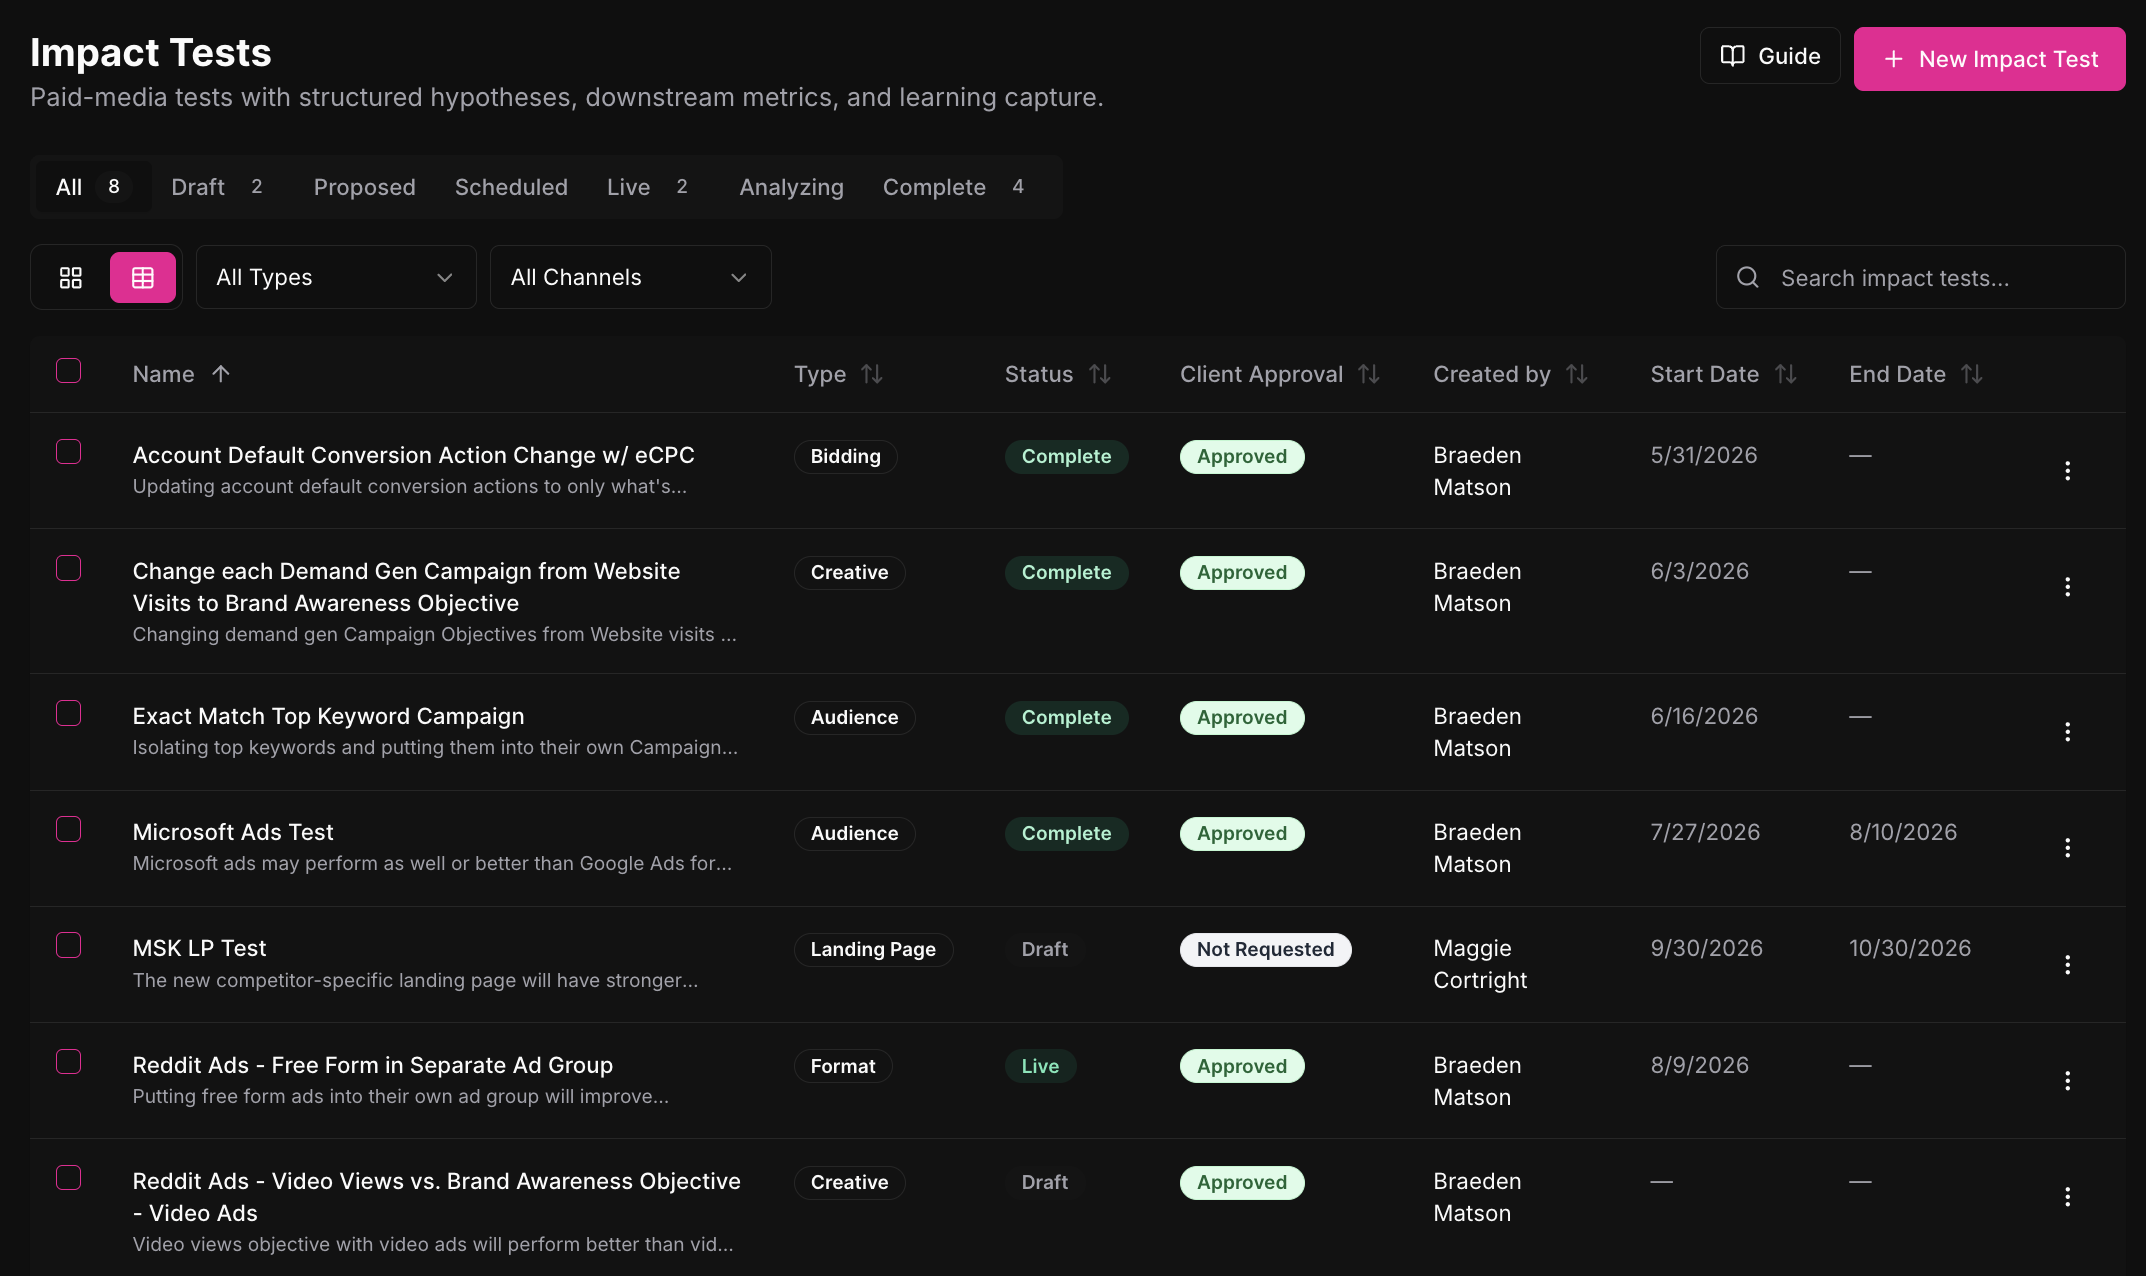
Where AI helps
We built Omni OS to remove the friction that slows a paid program down. In practice, AI helps in many places, but this is how we are using it to make better decisions, surface insights quicker, and get campaigns live faster.
| Where | What it does | Who decides |
|---|---|---|
| Anomaly detection | Rule-based checks run first, then a statistical comparison against a 90-day baseline. AI adds a root-cause summary only for confirmed anomalies. | Our team reviews every finding before acting |
| Search term review | Classifies the searches that triggered ads as negate, promote, monitor, or ignore | Our team actions the classifications |
| Questions about performance | Answers plain-language questions about campaigns, budget, messaging, and past meeting decisions | The person asking |
| Drafting | First drafts of ad copy and content from the client's own brief and messaging | Reviewed and edited by our team before the client sees it |
| Budget pacing | Tracks spend against plan across every channel throughout the day, and flags a channel running ahead or behind well before month end | Our team adjusts pacing; budget changes go to the client for approval |
| Keyword research and media planning | Builds keyword ideas and a draft media plan from the client's brief, goals, and budget | Our strategist refines it; the client approves the plan |
| Audience engagement analysis | Shows which accounts, titles, and industries are engaging with ads, including engaged accounts with no deal in the CRM yet | Our team decides what to change; sales decides who to follow up with |
Each row has a person in the last column. AI outputs in Omni OS aren't applied on their own.
Where AI doesn't help
AI doesn't know which segments create pipeline for your business until someone pulls the CRM data. It doesn't know which pain points your buyers rank highest until someone talks to them. It can't decide whether this is the quarter to invest in brand or protect cash. And it can't tell you whether a test result is real or a coincidence of timing.
Here is what I believe most strongly about all of this: AI speeds up whatever strategy sits underneath it. If the strategy is sound, you get to results faster. If it isn't, you get to the wrong place faster.
Ask your team or agency for a list of every test run in the last six months: the hypothesis, how long it ran, and what was learned. If the list is short, or the tests ran for two weeks, or no one can say what changed because of them, the program is reacting, not learning.
The Last Word
Somewhere in a CRM, I'm a closed-lost opportunity.
The de-anonymization vendor from Chapter 1 did a lot of things right. Their name came up in conversation, their Director of Demand Gen kept showing up in my feed, and when I came back months later, I knew exactly who to call. I didn't buy because our priorities changed, not because they lost. If their program is still in front of me when those priorities shift again, there's a good chance I'll be back.
That's the whole idea of this report. Most of your market isn't buying today. The ones who will buy next year are forming their shortlist now, mostly out of your sight, and increasingly with help from AI. The program that wins stays in front of them through the loops, captures them efficiently when they're ready, and measures both against pipeline instead of leads.
You won't do everything in these pages this quarter, and you shouldn't try. Pick the one question from the checklist that would be most uncomfortable to answer in front of your CFO. Start there.
The Leader's Checklist
Bring these questions to your next quarterly review with your team or agency. You don't need to know how to answer them yourself. You need to know whether someone can.
Diagnosis
Paid social
Creative
Paid search
Measurement and discipline
Where to Go From Here
If something in these pages sounds like your program, our team would be glad to take a look. We'll review your paid search and paid social accounts: tracking, structure, targeting, and how spend lines up with pipeline. Then we'll tell you plainly what we'd keep, what we'd fix, and what we'd stop.
No pitch deck. If the honest answer is that your program is in good shape, we'll say so.
And if you want more conversations like the ones quoted in this report, you can find them on The Demand Podcast.
omnilabconsulting.comMethodology and Sources
This report combines published research with Omni Lab's own client data. Clients are named only where their case study is already public, and exact spend is withheld throughout. Data drawn from our own programs is labeled as ours in the text. Where outside research is cited, it is linked below.
Outside research
- 6sense. 2025 B2B Buyer Experience Report. Day One shortlist, first contact timing, pre-contact favorite.
- Ahrefs. Update: AI Overviews Reduce Clicks by 58% (December 2025 data), and the original April 2025 study of 300,000 keywords.
- Binet, L. and Field, P., for the LinkedIn B2B Institute. The 5 Principles of Growth in B2B Marketing (2019). Summarized by LinkedIn.
- Dawes, J., Ehrenberg-Bass Institute, for the LinkedIn B2B Institute. The 95:5 rule (2021). Summarized in Marketing Week and by the Ehrenberg-Bass Institute.
- Dreamdata. 2026 LinkedIn Ads B2B Benchmarks, as reported by CMOtech. Journey length and share of journey before pipeline.
- Forrester. The State of Business Buying, 2024. Purchase stalls and buying group size.
- G2. The Answer Economy research, March 2026. AI chatbot use in B2B software research.
- Gartner. The marketing-to-sales handoff should no longer exist (2018), on looping. B2B buyers' time with suppliers, on the 17% figure.
- Google and Bain. B2B Discovery to Devotion study (2022), as reported in Marketing Dive. Day One lists.
- HockeyStack. B2B Customer Journey Touchpoints. Touchpoints to MQL and from SQL to close.
- Schwartz, E. Breakthrough Advertising (1966). Five levels of awareness.
- System1 Group. Research on ad wear-out (February 2023), as cited in Omni Lab's The Modern Way B2B SaaS Brands Run LinkedIn Ads.
- UserGems. Results of one-to-one ads to open opportunities, as shared with Omni Lab for The Modern Way B2B SaaS Brands Run LinkedIn Ads.
Podcast interviews: Nick Turner, CEO of Dreamdata (Chapter 13), and John Dawes, Ehrenberg-Bass Institute (Chapter 2), on The Demand Podcast.
Omni Lab data
- Opportunity title analyses from a Series C and a Series B client (Chapter 6).
- Six months of LinkedIn reach, frequency, and CPM data from a Series B client, September 2023 to February 2024 (Chapter 8).
- Poll of B2B SaaS marketing leaders on confidence in conversion tracking, and onboarding audit findings (Chapter 5).
- Client case studies (Chapters 5, 10, 11, 12, and 14), and Google Ads CTR trends across roughly 40 accounts, January 2025 to October 2026 (Chapter 3).
Published Omni Lab case studies: ShareGate, Billd, Miter, and Thoropass.
Keep reading
Unlock Parts I through V, the checklist, and the full 88-page PDF.
Want this kind of thinking applied to your own program?
Book a strategy call and we will pressure-test your paid media in 30 minutes.