Most B2B SaaS brands run LinkedIn Ads the wrong way, chasing demos from buyers who aren't ready, over-indexing on senior titles, and then blaming the channel when pipeline doesn't follow. After working with 200+ B2B SaaS brands, the pattern is clear: LinkedIn is a brand-building channel first, and direct-response second. The brands that win accept a longer measurement horizon, build presence with their ICP before those buyers are in-market, and use CRM data to validate targeting rather than gut instinct.
The Modern Way B2B SaaS Brands Run LinkedIn Ads: A Full Breakdown
LinkedIn’s ad business has quietly become enormous.
Microsoft doesn’t break out LinkedIn advertising revenue separately in its 10-K, but industry estimates now place LinkedIn ads at roughly $8B+ annually by 2025, up from roughly $2.5B in 2019.
Meanwhile, Microsoft continues to report that LinkedIn growth is increasingly driven by Marketing Solutions (its advertising business).
At the same time, Dreamdata benchmark data shows B2B companies increased LinkedIn’s share of ad budgets from 31% to 39% in 2024 alone.
And yet, most B2B SaaS brands still run LinkedIn ads the wrong way.
They chase demos from buyers who aren't ready. They target VP-level titles and wonder why nobody converts. They declare the channel doesn't work, redirect the budget to search, and then watch the overall pipeline quality decline two quarters later.
Here’s what we've seen working across 200+ B2B SaaS brands we have worked with over the last 6 years. What follows is a breakdown of the framework we use to plan, execute, and measure LinkedIn Ads for companies from Series A through PE-backed, and what actually separates campaigns that build pipeline from ones that burn budget.
Chapter 1: Goals Start With an Honest Objective
Most LinkedIn campaigns fail before they launch because nobody has agreed on what the channel is actually supposed to do.
LinkedIn is not Google Search. People are not on LinkedIn to evaluate software vendors. They're there to consume content, learn something, or scroll between meetings. That behavioral reality has direct implications for how you set goals and measure success.
There are two distinct objectives on LinkedIn: brand awareness and performance marketing. Both matter. The mistake is treating them as the same thing or ignoring one entirely.
Brand awareness campaigns are built to create mental availability and brand preference. The goal is to associate your brand with the product category and the specific situations that prompt buyers to start looking. When a buyer eventually reaches the evaluation stage, you want to already exist in their mental shortlist. Research from the B2B Institute and Ehrenberg-Bass shows that 82% of buyers already have a brand in mind when they form that shortlist. If you aren't present during the out-of-market phase, you're competing from behind.
Performance marketing campaigns are built to capture buyers who are actively in-market. These should represent roughly 30-40% of your LinkedIn budget (though this can vary based on audience size). More than that, and you're over-indexing on a small, expensive pool of buyers that will always have diminishing returns.
The practical budget split: aim to allocate 60-70% of your LinkedIn budget to cold audiences, targeting 40-50% of your total audience. Why 40-50%? Not everyone in your audience is active on LinkedIn in any given 30-day window. Spending more past that threshold doesn't extend reach; it just increases frequency with people who've already seen you.
One more thing: brand metrics like social mentions, share of voice, and branded search volume can be hard to sell internally. The reframing that works is to translate them into business outcomes. Instead of "branded search clicks increased 20%," say "branded search clicks have increased 20%, which at our current 2% conversion rate from branded traffic represents approximately 10 additional opportunities over the next six months."
That's the same data presented in the language of pipeline.
Chapter 2: Targeting Start With Your CRM, Not Your Instincts
The most common targeting mistake in LinkedIn Ads isn't a platform error. It's relying on assumptions rather than data.
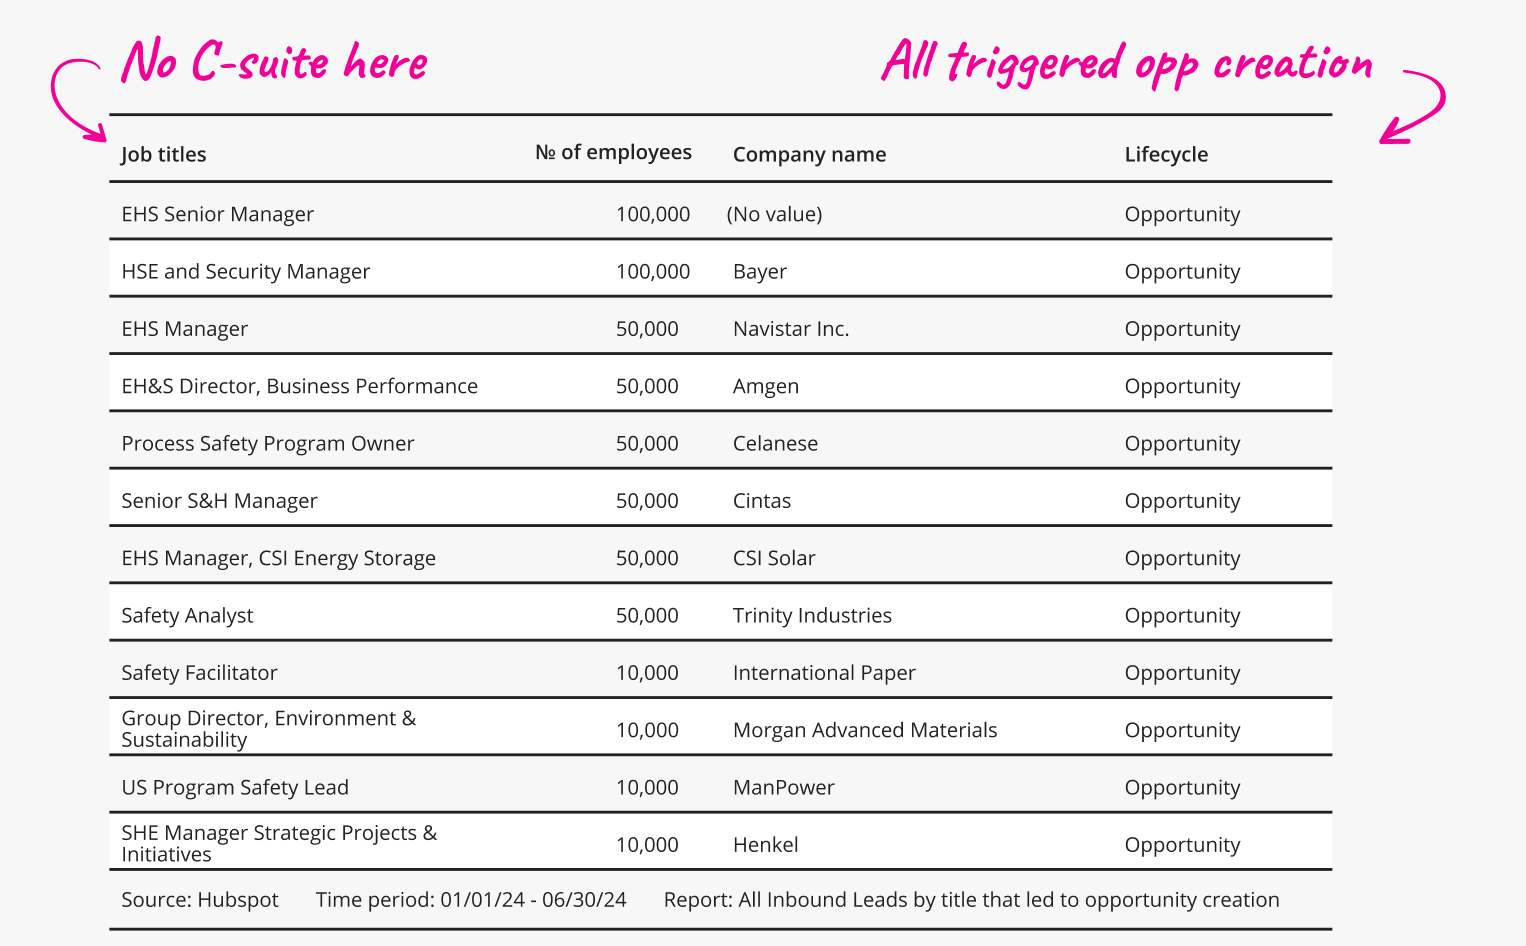
Before you build a single audience, pull the last six months of CRM data to understand which job titles, industries, company sizes, and geographies have historically produced the most opportunities. What you find often contradicts what sales thinks. The people who come inbound and trigger opportunity creation are rarely the C-suite; they're the managers and directors who actually feel the problem.
Across 200+ B2B SaaS brands, we consistently see opportunity creation driven by individual contributors and mid-level managers, not VPs and above. That doesn't mean you never target senior titles. It means you don't over-index on them. Senior buyers are more expensive to reach on LinkedIn, and they're often less aligned with the core pain your product solves.
Case in point. For example, the graphic below is a screenshot of a Series B B2B SaaS brand’s HubSpot showing the titles associated with opportunity creation. None of the titles above are VP-level+. And this isn't an isolated event, but something we see repeatedly.
The four primary audience types:
Target account lists (TALs) are the highest-performing starting point according to data across our entire portfolio. Sync your TAL directly from your CRM into LinkedIn via a connector. Layer job title, function, and company size on top. The psychological principle at work is the mere exposure effect buyers who already have some familiarity with your brand are more likely to respond to outreach and convert downstream.
Native firmographic targeting is the fallback when you don't have a TAL. LinkedIn's campaign manager lets you build audiences by job title, job function, company size, industry, and growth rate. The downside is that it casts a wider net and may include accounts that fall outside your ICP on criteria you can't filter for natively (tech stack, number of locations, etc.).
Intent and signal-based audiences built using tools like Bombora, 6sense, or Primer can outperform cold audiences when you need short-term wins. The catch: these audiences only surface a fraction of your ICP, they're more expensive because competitors target them simultaneously, and they don't solve the fundamental problem of being unknown before buyers go in-market.
Retargeting is a catch-all for anyone who has visited your website, engaged with your ads, or visited your LinkedIn company page in the last 90 to 180 days. The creative strategy here shifts. Social proof ads work best for buyers who know the brand but haven't gone deep. Product marketing ads drive understanding in the consideration phase. Direct-response offers (demos, assessments) are reserved only for the warmest segment.
Note: ignore the conventional "50,000 to 250,000" guidance. If your total ICP is 3,500 people, target those 3,500 people. Expanding your audience to hit a benchmark number means reaching people who will never buy from you.
Chapter 3: Messaging One to Three Pillars, Repeated Deliberately
Noisy markets aren't won by saying more things. They're won by saying fewer things more often.
Start by defining your positioning, the problem you solve and how you solve it differently from the alternatives. From that, identify one to three core messages per audience segment. Those messages need to connect your brand to the specific situations that prompt buyers to look for a solution like yours.
The Calendly example from the guide is a useful model. The trigger Calendly owns is the back-and-forth that occurs during scheduling. Their messaging doesn't lead with features. It leads with the frustration: "No more back and forth. Automate meeting scheduling." The feature (calendar automation) follows. The outcome (fewer rejected meetings, more accepted ones) is the destination.
That structure, situation, problem, capability, and outcome is a repeatable template for any messaging pillar.
On funnel-based content sequencing: resist the instinct to push buyers from TOFU to MOFU to BOFU through a sequence of different content types. Google's research on the "messy middle" of the purchase journey found that buyers loop between exploration and evaluation non-linearly, across many touchpoints, over a period that Dreamdata clocks at an average of 192 days. You can't engineer their journey. You can be consistently present across it.
The more practical frame: make content that's worth consuming at any point in the journey. A case study is typically labeled a BOFU asset, but a well-written customer success story is interesting to anyone trying to understand how a problem gets solved, regardless of whether they're actively evaluating.
The four content types that belong in every campaign: thought leadership, product marketing, TOFU educational content, and social proof. Each serves a different buyer mindset. Thought leadership builds authority. Product marketing builds understanding. Educational content builds relevance. Social proof reduces risk.
Chapter 4: Ad Creative, Three Jobs Every Ad Needs to Do
Creatives are where most LinkedIn campaigns fall apart, even when targeting and messaging are solid. The symptoms are vague headlines, jargon-heavy copy, and visuals that are disconnected from the brand.
Every LinkedIn ad needs to accomplish three things:?
Overcome ad friction. Ad friction is anything that creates resistance or confusion for the viewer vague language, misaligned visuals, unclear CTAs. "Work smarter. Connect better." is a clever line that communicates nothing. "No more back and forth. Automate meeting scheduling." is a clear line that communicates exactly what Calendly does. Clarity beats cleverness every time.
Link your brand to key buying situations. If you associate your brand with the specific trigger that causes buyers to start looking the frustration, the failure mode, the inefficiency they'll recall you when they encounter that trigger. This is what the Ehrenberg-Bass Institute calls category entry points. Your ads should build that association deliberately, not assume buyers will make the connection on their own.
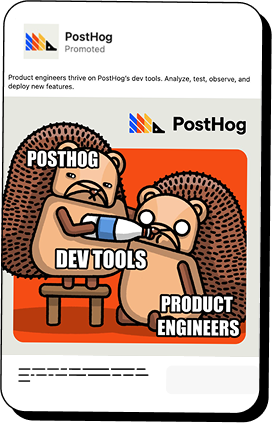
Use distinctive brand elements. The goal of not "looking like an ad" should not mean abandoning your brand. Each ad should use consistent colors, iconography, and voice across campaigns so buyers develop recognition over time. PostHog's mascot is a useful benchmark here. After enough exposures, you'd recognize the brand from the visual alone, without any text.
On format selection: single image ads are the most common because they're easiest to produce and most visible in the feed. Thought Leader Ads run from personal profiles rather than brand pages consistently outperform brand page ads on trust and engagement. Data across the brands Omni Lab works with shows that Spotlight Ads have the lowest CPC and CPM, but lowest reach as well. Format should follow the communication need, not the cost-per-click.
On refreshing creative: the research from System1 Group shows that high-quality ads don't wear out they can actually improve over time as familiarity builds. The Ebbinghaus Forgetting Curve is the counterpoint: buyers forget 50% of what they learn within days. The practical implication is that good ads should run longer than most marketing teams allow, while frequency caps (7-9 impressions per member per 30 days at the campaign level) prevent oversaturation.
For early-stage brands still validating messaging, test large changes completely different problem framings, distinct headlines not small variables like button colors.
On in-channel consumption: LinkedIn's average CTR is 0.4-0.6%. That means more than 99% of people who see your ad do not click. That isn't waste. It's reach. The goal of LinkedIn is not to win the click it's to build the association so that when a buyer types your category into a search bar three months later, your brand is the one they look up.
Document ads, carousels, and organic posts promoted as Thought Leader Ads all create opportunities for in-feed consumption without requiring a click. Design content with that in mind.
Chapter 5: Landing Pages The Three Fundamentals That Actually Move Conversion
Most B2B SaaS landing page optimization focuses on the wrong variables. Button colors, form field counts, and CTA wording are marginal changes. The things that actually determine whether traffic converts to pipeline are: messaging clarity, page strategy, and social proof placement.
Messaging clarity: your landing page has milliseconds to tell a visitor what you do and why they should care. If the answer requires mental gymnastics to decode, you've already lost them. The pattern that works is outcome-driven, problem-first messaging: acknowledge the struggle before presenting the solution. "Stop wasting 40% of your ad spend on leads that never convert" lands differently than "Improve your marketing efficiency," even though they describe the same product benefit. One creates recognition. The other sounds like every other SaaS headline.
Indexed vs. non-indexed pages: the default agency recommendation is always a dedicated, non-indexed landing page per campaign. That's not always right. If you already have product or solution pages that clearly communicate your value proposition and align with your campaign's keywords, use them. They carry more SEO authority, provide better user experience through navigation, and reduce the overhead of maintaining parallel page variations.
Reserve non-indexed landing pages for testing messaging that conflicts with your main site positioning, targeting highly specific segments with distinct value propositions, or promoting time-bound offers.
Social proof placement: most B2B SaaS sites bury social proof at the bottom of the page. That's backwards. Your strongest validation customer logos, quantified case study results, G2 ratings should appear above the fold, integrated with your headline and value proposition. And the social proof should match the prospect you're targeting. If you're going after marketing managers at mid-market companies, a wall of Fortune 500 logos creates a relevance gap, not confidence.
Pair high-level credibility signals (logo bars, review ratings) with objection-specific testimonials placed near the part of the page where that objection would naturally arise.
Chapter 6: Campaign Strategy and Budget Allocation
Campaign architecture is where strategy either holds together or comes apart. Four decisions made before launch determine most of the outcome: objective, audience, message, and budget.
Objective first: are you building awareness in your ICP, capturing in-market demand, or accelerating existing pipeline? Each requires different targeting, creative, and measurement. Most teams try to accomplish all three with generic "awareness" campaigns and end up accomplishing none.
Budget allocation by audience layer: Use the following variables to build a media plan: historical CPM, audience size, and target frequency. Multiply audience size by target reach percentage (40-50% for cold, 80%+ for retargeting active pipeline) to get projected reach. Multiply by frequency to get impressions. Multiply impressions by CPM to get the max budget. Divide the actual approved budget by the max budget to understand what percentage of the audience you'll realistically reach.
A working example: a cold ICP audience of 19,000 people, targeted at 40% reach with a frequency of 5 and a CPM of $150, requires a max budget of $5,700. If the approved budget is $2,800, you'll reach roughly 20% of that audience. That's useful information before you launch, not after.
Starting split: 60% brand influence (cold, broad ICP campaigns across four content types) and 40% direct response (retargeting, gated assets, pipeline acceleration). Adjust over time based on pipeline data.
Naming conventions: consistent naming is not optional. Campaign names are embedded in UTM parameters and passed to your CRM. Inconsistent names break attribution models, complicate RevOps workflows, and make reporting inaccurate. The Omni Lab convention: Omni | [Channel] | [Objective] | [Creative Type] | [Audience] | [Format] applied consistently across every campaign, ad set, and lead gen form.
Chapter 7: Measurement Five Stages Most Brands Never Reach
LinkedIn attribution is not like search attribution. Buyers who saw your ads three weeks ago and then converted through organic search or direct traffic will show up as a search or direct conversion in your last-click model. LinkedIn gets no credit. Pipeline quality declines. The channel gets paused.
This is the measurement trap that causes brands to chronically underinvest in the channel that's building their future pipeline.
There are five measurement stages, and most B2B SaaS brands never progress past the first:
Stage 1 UTM tracking: every campaign URL is tagged with source, medium, campaign, creative, and audience variables. This feeds GA4 and your CRM with click-level data. The Omni Lab UTM structure captures campaign group name, campaign name, account ID, and creative ID, everything needed to trace a conversion back to the specific ad that drove it.
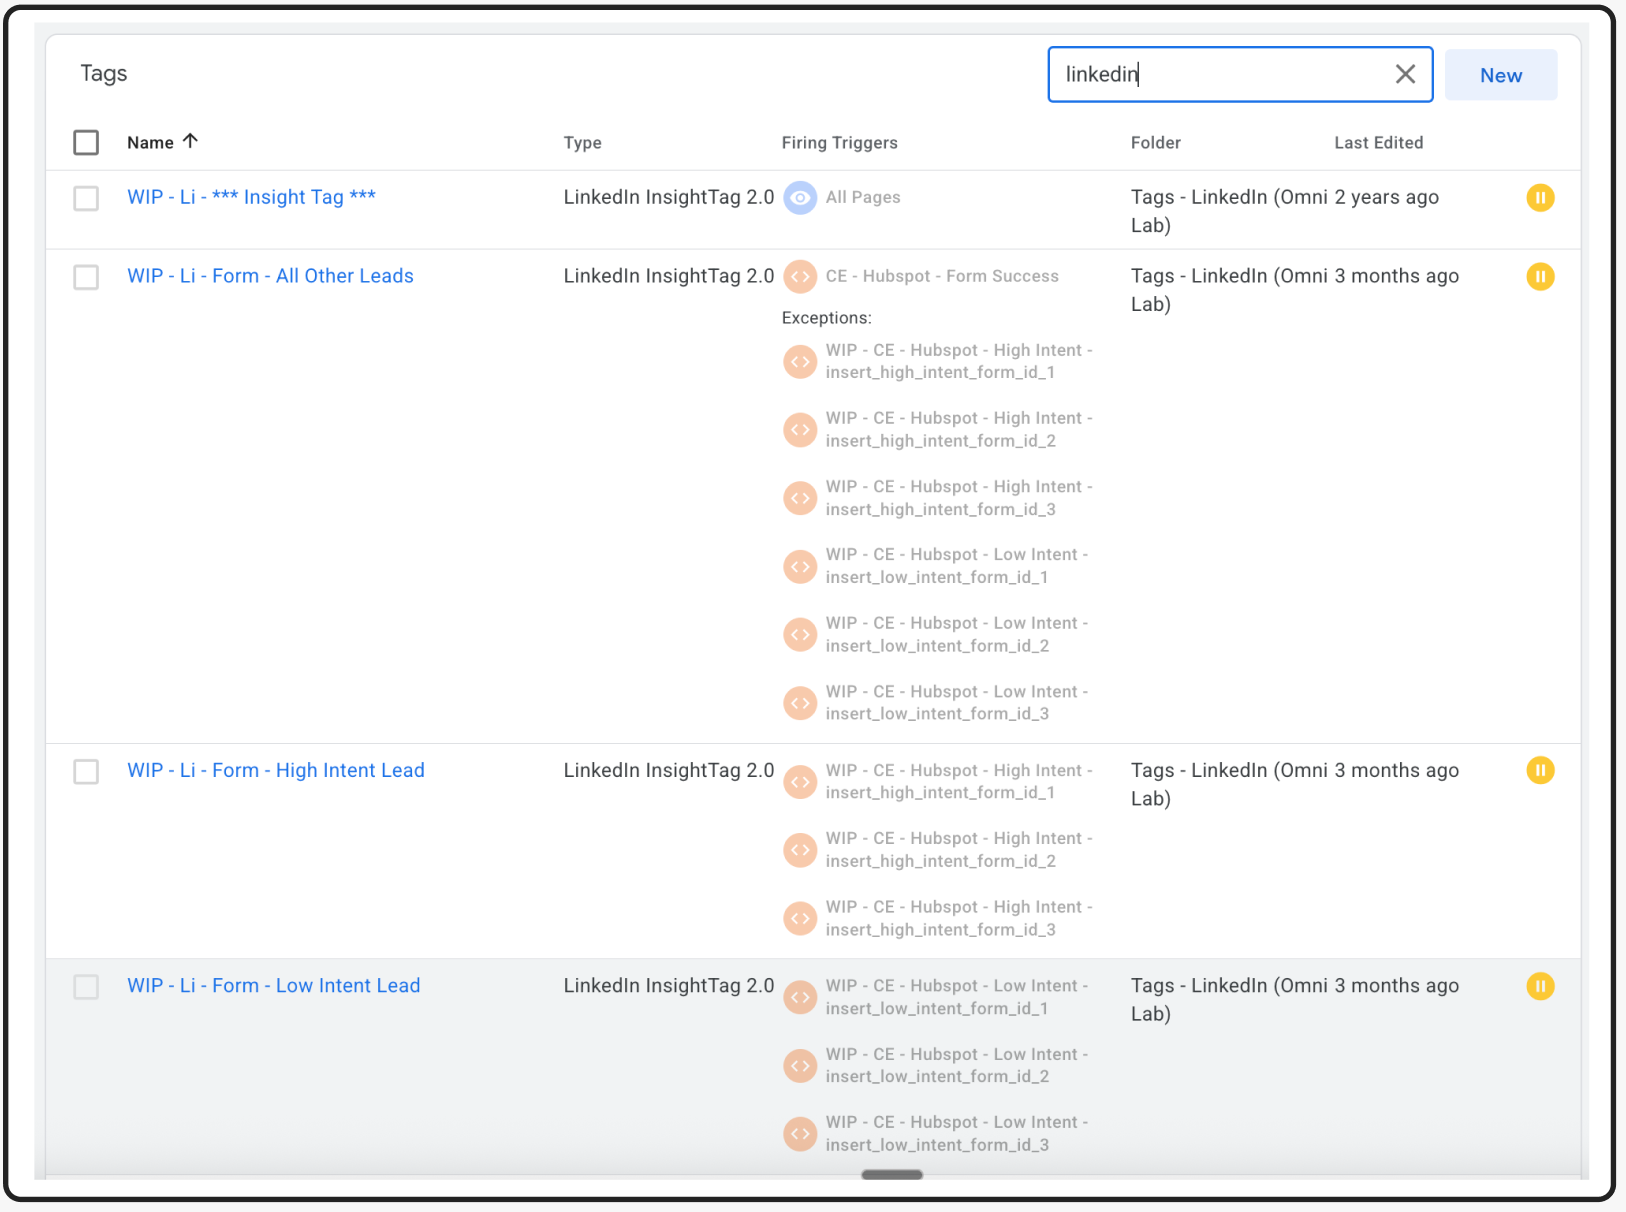
Conversion tracking setup should group events by intent level: high-intent (demo requests, trial sign-ups, contact forms), low-intent (webinar registrations, content downloads, newsletter subscriptions), and a catch-all group. The catch-all is useful for identifying forms you may have missed in your tracking setup. Something like this:
Stage 2 Qualitative data: "How did you hear about us?" on forms and call recording analysis from tools like Gong or Chorus surface attribution signals that don't show up in UTM data. Self-reported attribution is imprecise but often more accurate than last-click for awareness-driven channels.
Stage 3 Offline conversion tracking: upload closed-won deals and opportunity creation events from Salesforce or HubSpot back into LinkedIn Ads. This matches buyers who engaged with your ads at any point against deals that eventually closed, giving you a signal that extends beyond the click-to-conversion window.
Stage 4 Influence reporting: measure whether LinkedIn ad exposure contributed to pipeline even without a direct click or conversion. Account-level overlap between ad engagement and CRM pipeline is the signal. This is particularly useful in ABM motions where you're targeting accounts already in an active sales cycle.
Stage 5 Incrementality testing: expose one group of your target audience to LinkedIn ads and withhold exposure from a control group. Compare pipeline generation rates between the two. This is the most rigorous way to isolate LinkedIn's causal contribution and the only way to definitively answer whether the channel is generating lift or just taking credit for organic demand.
A meaningful incrementality test requires 30 to 90 days, a statistically valid control group (typically 20-30% of your target audience), and clean pipeline data. Most brands don't have the volume to run this monthly, but it's worth running once per major campaign to validate investment levels.
Chapter 8: Optimization What to Touch, and When
Optimization on LinkedIn is not a weekly activity. Over-optimization is as dangerous as inactivity pulling campaigns before they've delivered enough impressions, rotating creative before frequency builds, and constantly adjusting targeting before the algorithm has stabilized.
The four dimensions of optimization that actually move performance:
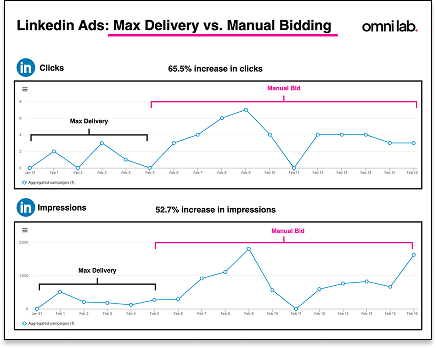
Manual vs. automated bidding: LinkedIn's automated bidding (Maximum Delivery) tends to outperform manual bidding once campaigns have sufficient data. Manual CPC gives you more control early in a campaign when you're establishing CPL baselines and don't want to overspend while the algorithm learns.
Firmographic analysis: regularly audit the company demographics behind your impressions. LinkedIn will sometimes allocate significant spend to companies outside your ICP due to native targeting overlap. Monthly firmographic reviews let you exclude those accounts before they drain budget.
Audience segmentation: as campaigns accumulate engagement data, segment your retargeting audiences by behavior (video viewers vs. website visitors vs. lead-gen form engagers) and by recency (30, 60, 90, or 180 days). Each segment gets different creative mapped to where that buyer is likely to be in their journey.
Balancing optimization with stability: LinkedIn's algorithm needs time and data to optimize delivery. Frequent changes to targeting, bidding, and creative reset the learning phase. The cadence that works: weekly pacing and CTR review, monthly creative rotation, quarterly full-funnel review across impressions, engagement, pipeline, and closed-won.
The Underlying Principle
Every chapter of this framework points back to the same structural reality: LinkedIn is a brand-building channel that also generates direct-response results when the conditions are right. It is not a lead generation channel that occasionally builds brand.
That framing determines everything, how goals are set, how the budget is allocated, how the creative is built, and how the measurement is interpreted.
The brands that get LinkedIn right are the ones that accept a longer measurement horizon, build consistent presence with their ICP before those buyers are in-market, and use CRM data to validate targeting rather than relying on assumptions. The brands that fail are the ones optimizing for demo requests from buyers who came to LinkedIn to read articles.
This guide is the operating manual for the former. The tactics change. The principles don't.
Most ABM strategies aren't failing because of bad targeting. They're failing because teams try to run them at full scale before proving the model works. I sat down with Andrei on the Demand podcast to talk through the account tiering framework and pilot structure that fixes this, and why lead scoring was never built to answer the question teams are actually asking of it.
"Demand gen" has sadly become synonymous with lead generation and performance marketing. But the best agencies still understand that brand preference and demand capture are complementary, not competing. This guide breaks down how the top demand gen agencies work and why it's so important to be philosophically aligned before getting sold on the word "demand gen".
ChatGPT has 900 million weekly active users, but ads only reach the 19% on the free tier. Our own poll found that 74% of SaaS marketers are already on paid plans, meaning most of your ICP has already opted out before you spend a dollar.